Capital allocators
Is the district premium embedded in this price supported by the district around it?
Business tenure and four-year turnover say whether the roster behind the rent has lasted.
Engagement: Acquisition District Screen
Find a districtHall Capital Advisory research
District-level underwriting for capital allocators, owners and developers, and cities and district organizations.
Hall Capital Advisory reads each downtown inside the boundary its city adopted: how long its businesses have traded, how fast they turn over, and how much of the street the largest private owner holds. The evidence is published here. An engagement applies it to one decision on one street.
Capital allocators
Business tenure and four-year turnover say whether the roster behind the rent has lasted.
Engagement: Acquisition District Screen
Find a districtOwners and developers
Four-year turnover and the largest private holder say how fast the frontage turns over and whether one owner can steer it.
Engagement: Ground-Floor Strategy
Find a districtCities and district organizations
The largest private holder says whether any private party holds enough of the street to act.
Engagement: District Capital Plan
Find a districtBring an address. The Index is read by district, not by street address. Send the address and the decision it serves, and Hall Capital Advisory will identify the district reading or the engagement that fits.
No district chosen yet. Choose one above, or search the map below.
Every reading here is a planning input: what the public record supports, not an appraisal, not investment advice, and not a substitute for diligence on a specific asset.
Read on CB Central Business zoning district, 229 acres, rung 1, adopted downtown zoning district or overlay. Adopted under Abilene Land Development Code.
What this record means for a decision
Durability is tested in the Acquisition District Screen; who can act, in the District Capital Plan and the Ground-Floor Strategy.
HALL CAPITAL ADVISORY FINDINGHALL CAPITAL ADVISORY THRESHOLDAn interpretation of the bands below, not a score, a rank or advice.
Median years businesses have traded inside this boundary.
WITHHELD14 dated businesses sit inside this boundary, under the floor of 25. The reading is withheld rather than banded on that few.Openings + closures per 100 starting businesses over four years.
WITHHELD21 ground-floor businesses stood inside this boundary at the start of the window, under the floor of 40. The reading is withheld rather than banded on that few.Ownership concentration: share of commercial accounts held by the largest private owner group.
4.20%NO STANDING381 commercial accounts resolving to 202 owner groups.Structural context · No band or score
Structural presence mix
Baseline Presence is the structural context the three readings are read against. It carries no band and no score. Residents are the 2020 Census count and workers the LODES workplace count, each apportioned to this boundary by block area, with anyone who both lives and works inside the line counted once. It is not a count of observed pedestrian activity. 40 of the 120 census blocks this boundary meets lie wholly inside it.
PUBLIC DATAHALL CAPITAL ADVISORY DERIVED2020 Decennial Census P1_001N and LEHD LODES version 8.
Data status and source confidence
BOUNDARY STANDARDIZEDNOT CLASS A CERTIFIEDNot Class A certified. 2 of six gates passed. No composite is shown: the controlled composite is withheld. How the six gates work.
Sources. Tenure and turnover: Texas Alcoholic Beverage Commission licenses and Texas Comptroller sales tax permits, joined to the parcel address. Ownership: Taylor CAD appraisal export and parcel shapefile. Residents and workers: 2020 Decennial Census P1_001N and LEHD LODES version 8.
On the boundary itself The layer named CBD_Subdivision_Layer is a countywide subdivision layer of 591,000 acres, not the central business district. Abilene's TIRZ 2 carries the only genuine use restriction found in this batch: internal use only.
| Gate | Requirement | Disposition | Ledger code |
|---|---|---|---|
| G1 | Official district geometry | Passed | VERIFIED_PASS |
| G2 | Broad establishment universe | Refused on measurement: adopted footprint conflict | REFUSED_ON_MEASUREMENT_ADOPTED_FOOTPRINT_CONFLICT |
| G3 | Valid start history | Refused on measurement: adopted footprint conflict | REFUSED_ON_MEASUREMENT_ADOPTED_FOOTPRINT_CONFLICT |
| G4 | Valid trailing 48-month exit history | Refused on measurement: adopted footprint conflict | REFUSED_ON_MEASUREMENT_ADOPTED_FOOTPRINT_CONFLICT |
| G5 | Standardized ownership | Passed | VERIFIED_PASS |
| G6 | Harmonized context | Refused on measurement: adopted footprint conflict | REFUSED_ON_MEASUREMENT_ADOPTED_FOOTPRINT_CONFLICT |
Read on MX-FB-UD form based urban development district, 152 acres, rung 1, adopted downtown zoning district or overlay. Adopted under Albuquerque Integrated Development Ordinance, form based code.
What this record means for a decision
Durability is tested in the Acquisition District Screen; who can act, in the District Capital Plan and the Ground-Floor Strategy.
HALL CAPITAL ADVISORY FINDINGHALL CAPITAL ADVISORY THRESHOLDAn interpretation of the bands below, not a score, a rank or advice.
Median years businesses have traded inside this boundary.
9.13 yearsSETTLINGprovisionalThe median across 1,362 businesses trading inside the line.Openings + closures per 100 starting businesses over four years.
WITHHELDNo register carrying a closing date covers this district.Ownership concentration: share of commercial accounts held by the largest private owner group.
6.55%NO STANDING290 commercial accounts resolving to 141 owner groups.Structural context · No band or score
Structural presence mix
Baseline Presence is the structural context the three readings are read against. It carries no band and no score. Residents are the 2020 Census count and workers the LODES workplace count, each apportioned to this boundary by block area, with anyone who both lives and works inside the line counted once. It is not a count of observed pedestrian activity. 20 of the 69 census blocks this boundary meets lie wholly inside it.
PUBLIC DATAHALL CAPITAL ADVISORY DERIVED2020 Decennial Census P1_001N and LEHD LODES version 8.
Data status and source confidence
BOUNDARY STANDARDIZEDNOT CLASS A CERTIFIEDNot Class A certified. 2 of six gates passed. No composite is shown: the controlled composite is withheld. How the six gates work.
Sources. Tenure and turnover: City of Albuquerque business registration. Ownership: Bernalillo County Assessor parcels. Residents and workers: 2020 Decennial Census P1_001N and LEHD LODES version 8.
| Gate | Requirement | Disposition | Ledger code |
|---|---|---|---|
| G1 | Official district geometry | Passed | VERIFIED_PASS |
| G2 | Broad establishment universe | Refused on measurement: adopted footprint conflict | REFUSED_ON_MEASUREMENT_ADOPTED_FOOTPRINT_CONFLICT |
| G3 | Valid start history | Refused on measurement: adopted footprint conflict | REFUSED_ON_MEASUREMENT_ADOPTED_FOOTPRINT_CONFLICT |
| G4 | Valid trailing 48-month exit history | Refused on measurement: adopted footprint conflict | REFUSED_ON_MEASUREMENT_ADOPTED_FOOTPRINT_CONFLICT |
| G5 | Standardized ownership | Passed | VERIFIED_PASS |
| G6 | Harmonized context | Refused on measurement: adopted footprint conflict | REFUSED_ON_MEASUREMENT_ADOPTED_FOOTPRINT_CONFLICT |
Read on Downtown District, 242 acres, rung 1, adopted downtown zoning district or overlay. Adopted under Ordinance 4068-2-24, 10 January 2023.
What this record means for a decision
Durability is tested in the Acquisition District Screen; who can act, in the District Capital Plan and the Ground-Floor Strategy.
HALL CAPITAL ADVISORY FINDINGHALL CAPITAL ADVISORY THRESHOLDAn interpretation of the bands below, not a score, a rank or advice.
Median years businesses have traded inside this boundary.
WITHHELD1 dated business sits inside this boundary, under the floor of 25. The reading is withheld rather than banded on that few.Openings + closures per 100 starting businesses over four years.
WITHHELD1 ground-floor business stood inside this boundary at the start of the window, under the floor of 40. The reading is withheld rather than banded on that few.Ownership concentration: share of commercial accounts held by the largest private owner group.
18.47%APPROACHING157 commercial accounts resolving to 77 owner groups.Structural context · No band or score
Structural presence mix
Baseline Presence is the structural context the three readings are read against. It carries no band and no score. Residents are the 2020 Census count and workers the LODES workplace count, each apportioned to this boundary by block area, with anyone who both lives and works inside the line counted once. It is not a count of observed pedestrian activity. 31 of the 53 census blocks this boundary meets lie wholly inside it.
PUBLIC DATAHALL CAPITAL ADVISORY DERIVED2020 Decennial Census P1_001N and LEHD LODES version 8.
Data status and source confidence
BOUNDARY STANDARDIZEDNOT CLASS A CERTIFIEDPasses all six gates and is not Class A certified. Six passed gates is not certification. No composite is shown: the controlled composite is withheld. How the six gates work.
Sources. Tenure and turnover: Texas Alcoholic Beverage Commission licenses and Texas Comptroller sales tax permits, joined to the parcel address. Ownership: Collin CAD property roll, data.texas.gov 5tkr-3759. Residents and workers: 2020 Decennial Census P1_001N and LEHD LODES version 8.
On the boundary itself A where clause of 1=1 returns the district plus four sub-overlays that sit inside it; summing them overstates the area by 40 percent.
| Gate | Requirement | Disposition | Ledger code |
|---|---|---|---|
| G1 | Official district geometry | Passed | VERIFIED_PASS |
| G2 | Broad establishment universe | Passed | VERIFIED_PASS |
| G3 | Valid start history | Passed | VERIFIED_PASS |
| G4 | Valid trailing 48-month exit history | Passed | VERIFIED_PASS |
| G5 | Standardized ownership | Passed | VERIFIED_PASS |
| G6 | Harmonized context | Passed | VERIFIED_PASS |
Read on TIRZ Center City Zone 1, 1,164 acres, rung 3, downtown-purposed special district. Adopted under City reinvestment zone.
What this record means for a decision
Durability is tested in the Acquisition District Screen; who can act, in the District Capital Plan and the Ground-Floor Strategy.
HALL CAPITAL ADVISORY FINDINGHALL CAPITAL ADVISORY THRESHOLDAn interpretation of the bands below, not a score, a rank or advice.
Median years businesses have traded inside this boundary.
WITHHELD22 dated businesses sit inside this boundary, under the floor of 25. The reading is withheld rather than banded on that few.Openings + closures per 100 starting businesses over four years.
WITHHELD29 ground-floor businesses stood inside this boundary at the start of the window, under the floor of 40. The reading is withheld rather than banded on that few.Ownership concentration: share of commercial accounts held by the largest private owner group.
3.86%NO STANDING699 commercial accounts resolving to 373 owner groups.Structural context · No band or score
Structural presence mix
Baseline Presence is the structural context the three readings are read against. It carries no band and no score. Residents are the 2020 Census count and workers the LODES workplace count, each apportioned to this boundary by block area, with anyone who both lives and works inside the line counted once. It is not a count of observed pedestrian activity. 232 of the 287 census blocks this boundary meets lie wholly inside it.
PUBLIC DATAHALL CAPITAL ADVISORY DERIVED2020 Decennial Census P1_001N and LEHD LODES version 8.
Data status and source confidence
BOUNDARY STANDARDIZEDNOT CLASS A CERTIFIEDPasses all six gates and is not Class A certified. Six passed gates is not certification. No composite is shown: the controlled composite is withheld. How the six gates work.
Sources. Tenure and turnover: Texas Alcoholic Beverage Commission licenses and Texas Comptroller sales tax permits, joined to the parcel address. Ownership: StratMap 48375 and 48381 for owner, City of Amarillo PRADDataExternal for class. Residents and workers: 2020 Decennial Census P1_001N and LEHD LODES version 8.
| Gate | Requirement | Disposition | Ledger code |
|---|---|---|---|
| G1 | Official district geometry | Passed | VERIFIED_PASS |
| G2 | Broad establishment universe | Passed | VERIFIED_PASS |
| G3 | Valid start history | Passed | VERIFIED_PASS |
| G4 | Valid trailing 48-month exit history | Passed | VERIFIED_PASS |
| G5 | Standardized ownership | Passed | VERIFIED_PASS |
| G6 | Harmonized context | Passed | VERIFIED_PASS |
Read on DB Downtown Business zoning, 99 acres, rung 1, adopted downtown zoning district or overlay. Adopted under City zoning district.
What this record means for a decision
Durability is tested in the Acquisition District Screen; who can act, in the District Capital Plan and the Ground-Floor Strategy.
HALL CAPITAL ADVISORY FINDINGHALL CAPITAL ADVISORY THRESHOLDAn interpretation of the bands below, not a score, a rank or advice.
Median years businesses have traded inside this boundary.
WITHHELD8 dated businesses sit inside this boundary, under the floor of 25. The reading is withheld rather than banded on that few.Openings + closures per 100 starting businesses over four years.
WITHHELD11 ground-floor businesses stood inside this boundary at the start of the window, under the floor of 40. The reading is withheld rather than banded on that few.Ownership concentration: share of commercial accounts held by the largest private owner group.
9.40%A POSITION149 commercial accounts resolving to 80 owner groups.Structural context · No band or score
Structural presence mix
Baseline Presence is the structural context the three readings are read against. It carries no band and no score. Residents are the 2020 Census count and workers the LODES workplace count, each apportioned to this boundary by block area, with anyone who both lives and works inside the line counted once. It is not a count of observed pedestrian activity. 5 of the 52 census blocks this boundary meets lie wholly inside it.
PUBLIC DATAHALL CAPITAL ADVISORY DERIVED2020 Decennial Census P1_001N and LEHD LODES version 8.
Data status and source confidence
BOUNDARY STANDARDIZEDNOT CLASS A CERTIFIEDNot Class A certified. 2 of six gates passed. No composite is shown: the controlled composite is withheld. How the six gates work.
Sources. Tenure and turnover: Texas Alcoholic Beverage Commission licenses and Texas Comptroller sales tax permits, joined to the parcel address. Ownership: Tarrant AD commercial roll, PropertyData(Delimited)_C.txt. Residents and workers: 2020 Decennial Census P1_001N and LEHD LODES version 8.
On the boundary itself Arlington's Downtown Master Plan area is 298 acres against 99 for the zoning district, three times apart.
| Gate | Requirement | Disposition | Ledger code |
|---|---|---|---|
| G1 | Official district geometry | Passed | VERIFIED_PASS |
| G2 | Broad establishment universe | Refused on measurement: adopted footprint conflict | REFUSED_ON_MEASUREMENT_ADOPTED_FOOTPRINT_CONFLICT |
| G3 | Valid start history | Refused on measurement: adopted footprint conflict | REFUSED_ON_MEASUREMENT_ADOPTED_FOOTPRINT_CONFLICT |
| G4 | Valid trailing 48-month exit history | Refused on measurement: adopted footprint conflict | REFUSED_ON_MEASUREMENT_ADOPTED_FOOTPRINT_CONFLICT |
| G5 | Standardized ownership | Passed | VERIFIED_PASS |
| G6 | Harmonized context | Refused on measurement: adopted footprint conflict | REFUSED_ON_MEASUREMENT_ADOPTED_FOOTPRINT_CONFLICT |
Read on Downtown Austin Plan Districts, 1,026 acres, rung 2, adopted downtown plan area. Adopted under Council ordinance 20111208-093.
What this record means for a decision
Durability is tested in the Acquisition District Screen; who can act, in the District Capital Plan and the Ground-Floor Strategy.
HALL CAPITAL ADVISORY FINDINGHALL CAPITAL ADVISORY THRESHOLDAn interpretation of the bands below, not a score, a rank or advice.
Median years businesses have traded inside this boundary.
5.79 yearsTHINThe median across 2,606 businesses trading inside the line.Openings + closures per 100 starting businesses over four years.
103.7 per 100CHURNING93 opened and 74 closed against 2,273 ground-floor businesses at the start of the window.Ownership concentration: share of commercial accounts held by the largest private owner group.
4.55%NO STANDING909 commercial accounts resolving to 622 owner groups.Structural context · No band or score
Structural presence mix
Baseline Presence is the structural context the three readings are read against. It carries no band and no score. Residents are the 2020 Census count and workers the LODES workplace count, each apportioned to this boundary by block area, with anyone who both lives and works inside the line counted once. It is not a count of observed pedestrian activity. 210 of the 277 census blocks this boundary meets lie wholly inside it.
PUBLIC DATAHALL CAPITAL ADVISORY DERIVED2020 Decennial Census P1_001N and LEHD LODES version 8.
Data status and source confidence
BOUNDARY DISPLAYED — PROVENANCE MIGRATION PENDINGCLASS A CERTIFIEDHolds the governed Class A certification and passes all six gates. No composite is shown: the controlled composite is withheld. How the six gates work.
Sources. Tenure and turnover: Texas Alcoholic Beverage Commission licenses and Texas Comptroller sales tax permits, joined to the parcel address. Ownership: Travis CAD certified roll, PROP.TXT, fixed width. Residents and workers: 2020 Decennial Census P1_001N and LEHD LODES version 8.
| Gate | Requirement | Disposition | Ledger code |
|---|---|---|---|
| G1 | Official district geometry | Passed | VERIFIED_PASS |
| G2 | Broad establishment universe | Passed | VERIFIED_PASS |
| G3 | Valid start history | Passed | VERIFIED_PASS |
| G4 | Valid trailing 48-month exit history | Passed | VERIFIED_PASS |
| G5 | Standardized ownership | Passed | VERIFIED_PASS |
| G6 | Harmonized context | Passed | VERIFIED_PASS |
Read on C-5 Downtown District, 888 acres, rung 1, adopted downtown zoning district or overlay. Adopted under Baltimore City Code Article 32, Ordinance 16-581, effective 5 June 2017.
What this record means for a decision
Durability is tested in the Acquisition District Screen; who can act, in the District Capital Plan and the Ground-Floor Strategy.
HALL CAPITAL ADVISORY FINDINGHALL CAPITAL ADVISORY THRESHOLDAn interpretation of the bands below, not a score, a rank or advice.
Median years businesses have traded inside this boundary.
7.51 yearsSETTLINGprovisionalThe median across 62 businesses trading inside the line.Openings + closures per 100 starting businesses over four years.
72.5 per 100REPLACINGprovisional24 opened and 13 closed against 51 ground-floor businesses at the start of the window.Ownership concentration: share of commercial accounts held by the largest private owner group.
6.55%NO STANDING840 commercial accounts resolving to 557 owner groups.Structural context · No band or score
Structural presence mix
Baseline Presence is the structural context the three readings are read against. It carries no band and no score. Residents are the 2020 Census count and workers the LODES workplace count, each apportioned to this boundary by block area, with anyone who both lives and works inside the line counted once. It is not a count of observed pedestrian activity. 235 of the 365 census blocks this boundary meets lie wholly inside it.
PUBLIC DATAHALL CAPITAL ADVISORY DERIVED2020 Decennial Census P1_001N and LEHD LODES version 8.
Data status and source confidence
BOUNDARY STANDARDIZEDNOT CLASS A CERTIFIEDNot Class A certified. 3 of six gates passed. No composite is shown: the controlled composite is withheld. How the six gates work.
Sources. Tenure and turnover: Baltimore Board of Liquor License Commissioners license years, 2003 to 2026, assembled as a panel. Ownership: Baltimore City real property (Realproperty_OB). Residents and workers: 2020 Decennial Census P1_001N and LEHD LODES version 8.
| Gate | Requirement | Disposition | Ledger code |
|---|---|---|---|
| G1 | Official district geometry | Passed | VERIFIED_PASS |
| G2 | Broad establishment universe | Source unavailable | BLOCKED_SOURCE_UNAVAILABLE |
| G3 | Valid start history | Source unavailable | BLOCKED_SOURCE_UNAVAILABLE |
| G4 | Valid trailing 48-month exit history | Source unavailable | BLOCKED_SOURCE_UNAVAILABLE |
| G5 | Standardized ownership | Passed | VERIFIED_PASS |
| G6 | Harmonized context | Passed | VERIFIED_PASS |
Read on Downtown Arts, Main Street and Flex zoning, 40 acres, rung 1, adopted downtown zoning district or overlay. Adopted under Baytown Unified Land Development Code.
What this record means for a decision
Durability is tested in the Acquisition District Screen; who can act, in the District Capital Plan and the Ground-Floor Strategy.
HALL CAPITAL ADVISORY FINDINGHALL CAPITAL ADVISORY THRESHOLDAn interpretation of the bands below, not a score, a rank or advice.
Median years businesses have traded inside this boundary.
WITHHELD6 dated businesses sit inside this boundary, under the floor of 25. The reading is withheld rather than banded on that few.Openings + closures per 100 starting businesses over four years.
WITHHELD10 ground-floor businesses stood inside this boundary at the start of the window, under the floor of 40. The reading is withheld rather than banded on that few.Ownership concentration: share of commercial accounts held by the largest private owner group.
6.49%NO STANDING77 commercial accounts resolving to 60 owner groups.Structural context · No band or score
Structural presence mix
Baseline Presence is the structural context the three readings are read against. It carries no band and no score. Residents are the 2020 Census count and workers the LODES workplace count, each apportioned to this boundary by block area, with anyone who both lives and works inside the line counted once. It is not a count of observed pedestrian activity. 10 of the 33 census blocks this boundary meets lie wholly inside it.
PUBLIC DATAHALL CAPITAL ADVISORY DERIVED2020 Decennial Census P1_001N and LEHD LODES version 8.
Data status and source confidence
BOUNDARY DISPLAYED — PROVENANCE MIGRATION PENDINGNOT CLASS A CERTIFIEDNot Class A certified. 3 of six gates passed. No composite is shown: the controlled composite is withheld. How the six gates work.
Sources. Tenure and turnover: Texas Alcoholic Beverage Commission licenses and Texas Comptroller sales tax permits, joined to the parcel address. Ownership: Harris CAD certified roll, real_acct.txt. Residents and workers: 2020 Decennial Census P1_001N and LEHD LODES version 8.
On the boundary itself Two code fields disagree in punctuation, DT MS carries a space against DT-MS with a hyphen in a sibling service. The description field is left-padded, so an equality match on Downtown Arts returns zero. Overlapping parcel records overstate the area twofold if summed.
| Gate | Requirement | Disposition | Ledger code |
|---|---|---|---|
| G1 | Official district geometry | Passed | VERIFIED_PASS |
| G2 | Broad establishment universe | Passed | VERIFIED_PASS |
| G3 | Valid start history | Failed its threshold | FAILED_THRESHOLD |
| G4 | Valid trailing 48-month exit history | Failed its threshold | FAILED_THRESHOLD |
| G5 | Standardized ownership | Passed | VERIFIED_PASS |
| G6 | Harmonized context | Refused on measurement: superseded published footprint | REFUSED_ON_MEASUREMENT_SUPERSEDED_PUBLISHED_FOOTPRINT |
Read on CBD Central Business District zoning, 218 acres, rung 1, adopted downtown zoning district or overlay. Adopted under Beaumont Code chapter 28, section 28.03.012.
What this record means for a decision
Durability is tested in the Acquisition District Screen; who can act, in the District Capital Plan and the Ground-Floor Strategy.
HALL CAPITAL ADVISORY FINDINGHALL CAPITAL ADVISORY THRESHOLDAn interpretation of the bands below, not a score, a rank or advice.
Median years businesses have traded inside this boundary.
WITHHELD10 dated businesses sit inside this boundary, under the floor of 25. The reading is withheld rather than banded on that few.Openings + closures per 100 starting businesses over four years.
WITHHELD12 ground-floor businesses stood inside this boundary at the start of the window, under the floor of 40. The reading is withheld rather than banded on that few.Ownership concentration: share of commercial accounts held by the largest private owner group.
20.41%THE THRESHOLD147 commercial accounts resolving to 73 owner groups.Structural context · No band or score
Structural presence mix
Baseline Presence is the structural context the three readings are read against. It carries no band and no score. Residents are the 2020 Census count and workers the LODES workplace count, each apportioned to this boundary by block area, with anyone who both lives and works inside the line counted once. It is not a count of observed pedestrian activity. 34 of the 99 census blocks this boundary meets lie wholly inside it.
PUBLIC DATAHALL CAPITAL ADVISORY DERIVED2020 Decennial Census P1_001N and LEHD LODES version 8.
Data status and source confidence
BOUNDARY STANDARDIZEDNOT CLASS A CERTIFIEDNot Class A certified. 2 of six gates passed. No composite is shown: the controlled composite is withheld. How the six gates work.
Sources. Tenure and turnover: Texas Alcoholic Beverage Commission licenses and Texas Comptroller sales tax permits, joined to the parcel address. Ownership: StratMap 2025, TxGIO, Jefferson 48245. Residents and workers: 2020 Decennial Census P1_001N and LEHD LODES version 8.
On the boundary itself The Downtown Planning Area is 586 acres, 2.7 times the zoning district, and carries no ordinance. Beaumont's TIRZ 1A is 7,405 acres and merely contains downtown.
| Gate | Requirement | Disposition | Ledger code |
|---|---|---|---|
| G1 | Official district geometry | Passed | VERIFIED_PASS |
| G2 | Broad establishment universe | Refused on measurement: adopted footprint conflict | REFUSED_ON_MEASUREMENT_ADOPTED_FOOTPRINT_CONFLICT |
| G3 | Valid start history | Refused on measurement: adopted footprint conflict | REFUSED_ON_MEASUREMENT_ADOPTED_FOOTPRINT_CONFLICT |
| G4 | Valid trailing 48-month exit history | Refused on measurement: adopted footprint conflict | REFUSED_ON_MEASUREMENT_ADOPTED_FOOTPRINT_CONFLICT |
| G5 | Standardized ownership | Passed | VERIFIED_PASS |
| G6 | Harmonized context | Refused on measurement: adopted footprint conflict | REFUSED_ON_MEASUREMENT_ADOPTED_FOOTPRINT_CONFLICT |
Read on PLAN: Downtown, 239 acres, rung 2, adopted downtown plan area. Adopted under Boston Planning and Development Agency board, approved December 2023.
What this record means for a decision
Durability is tested in the Acquisition District Screen; who can act, in the District Capital Plan and the Ground-Floor Strategy.
HALL CAPITAL ADVISORY FINDINGHALL CAPITAL ADVISORY THRESHOLDAn interpretation of the bands below, not a score, a rank or advice.
Median years businesses have traded inside this boundary.
10.85 yearsSETTLINGprovisionalThe median across 616 businesses trading inside the line.Openings + closures per 100 starting businesses over four years.
46.2 per 100HELDprovisional164 opened and 83 closed against 535 ground-floor businesses at the start of the window.Ownership concentration: share of commercial accounts held by the largest private owner group.
11.91%NO STANDING1,058 commercial accounts resolving to 583 owner groups.Structural context · No band or score
Structural presence mix
Baseline Presence is the structural context the three readings are read against. It carries no band and no score. Residents are the 2020 Census count and workers the LODES workplace count, each apportioned to this boundary by block area, with anyone who both lives and works inside the line counted once. It is not a count of observed pedestrian activity. 104 of the 151 census blocks this boundary meets lie wholly inside it.
PUBLIC DATAHALL CAPITAL ADVISORY DERIVED2020 Decennial Census P1_001N and LEHD LODES version 8.
Data status and source confidence
BOUNDARY STANDARDIZEDNOT CLASS A CERTIFIEDNot Class A certified. 3 of six gates passed. No composite is shown: the controlled composite is withheld. How the six gates work.
Sources. Tenure and turnover: City of Boston Food Establishment Inspections, one row per license. Ownership: MassGIS Level 3 parcels, City of Boston (TOWN_ID 35). Residents and workers: 2020 Decennial Census P1_001N and LEHD LODES version 8.
| Gate | Requirement | Disposition | Ledger code |
|---|---|---|---|
| G1 | Official district geometry | Passed | VERIFIED_PASS |
| G2 | Broad establishment universe | Source unavailable | BLOCKED_SOURCE_UNAVAILABLE |
| G3 | Valid start history | Source unavailable | BLOCKED_SOURCE_UNAVAILABLE |
| G4 | Valid trailing 48-month exit history | Source unavailable | BLOCKED_SOURCE_UNAVAILABLE |
| G5 | Standardized ownership | Passed | VERIFIED_PASS |
| G6 | Harmonized context | Passed | VERIFIED_PASS |
Read on Downtown Core, Edge and General zoning, 284 acres, rung 1, adopted downtown zoning district or overlay. Adopted under Brownsville form-based zoning code.
What this record means for a decision
Durability is tested in the Acquisition District Screen; who can act, in the District Capital Plan and the Ground-Floor Strategy.
HALL CAPITAL ADVISORY FINDINGHALL CAPITAL ADVISORY THRESHOLDAn interpretation of the bands below, not a score, a rank or advice.
Median years businesses have traded inside this boundary.
4.05 yearsTHINThe median across 34 businesses trading inside the line.Openings + closures per 100 starting businesses over four years.
83.6 per 100CHURNING26 opened and 25 closed against 61 ground-floor businesses at the start of the window.Ownership concentration: share of commercial accounts held by the largest private owner group.
4.68%NO STANDING363 commercial accounts resolving to 231 owner groups.Structural context · No band or score
Structural presence mix
Baseline Presence is the structural context the three readings are read against. It carries no band and no score. Residents are the 2020 Census count and workers the LODES workplace count, each apportioned to this boundary by block area, with anyone who both lives and works inside the line counted once. It is not a count of observed pedestrian activity. 83 of the 144 census blocks this boundary meets lie wholly inside it.
PUBLIC DATAHALL CAPITAL ADVISORY DERIVED2020 Decennial Census P1_001N and LEHD LODES version 8.
Data status and source confidence
BOUNDARY STANDARDIZEDNOT CLASS A CERTIFIEDPasses all six gates and is not Class A certified. Six passed gates is not certification. No composite is shown: the controlled composite is withheld. How the six gates work.
Sources. Tenure and turnover: Texas Alcoholic Beverage Commission licenses and Texas Comptroller sales tax permits, joined to the parcel address. Ownership: Cameron CAD certified export, GCC. Residents and workers: 2020 Decennial Census P1_001N and LEHD LODES version 8.
On the boundary itself The ordinance field on every downtown feature is a single space rather than null, so a null test finds nothing. Brownsville's four candidates run 53, 283, 574 and 1,191 acres.
| Gate | Requirement | Disposition | Ledger code |
|---|---|---|---|
| G1 | Official district geometry | Passed | VERIFIED_PASS |
| G2 | Broad establishment universe | Passed | VERIFIED_PASS |
| G3 | Valid start history | Passed | VERIFIED_PASS |
| G4 | Valid trailing 48-month exit history | Passed | VERIFIED_PASS |
| G5 | Standardized ownership | Passed | VERIFIED_PASS |
| G6 | Harmonized context | Passed | VERIFIED_PASS |
Read on DT-C, DT-N and DT-S downtown zoning, 72 acres, rung 1, adopted downtown zoning district or overlay. Adopted under Bryan Code chapter 130; ordinances 1661, 1741, 1773, 2023, 2335, 2359, 2422, 2742.
What this record means for a decision
Durability is tested in the Acquisition District Screen; who can act, in the District Capital Plan and the Ground-Floor Strategy.
HALL CAPITAL ADVISORY FINDINGHALL CAPITAL ADVISORY THRESHOLDAn interpretation of the bands below, not a score, a rank or advice.
Median years businesses have traded inside this boundary.
WITHHELD23 dated businesses sit inside this boundary, under the floor of 25. The reading is withheld rather than banded on that few.Openings + closures per 100 starting businesses over four years.
WITHHELD28 ground-floor businesses stood inside this boundary at the start of the window, under the floor of 40. The reading is withheld rather than banded on that few.Ownership concentration: share of commercial accounts held by the largest private owner group.
5.59%NO STANDING161 commercial accounts resolving to 108 owner groups.Structural context · No band or score
Structural presence mix
Baseline Presence is the structural context the three readings are read against. It carries no band and no score. Residents are the 2020 Census count and workers the LODES workplace count, each apportioned to this boundary by block area, with anyone who both lives and works inside the line counted once. It is not a count of observed pedestrian activity. 12 of the 60 census blocks this boundary meets lie wholly inside it.
PUBLIC DATAHALL CAPITAL ADVISORY DERIVED2020 Decennial Census P1_001N and LEHD LODES version 8.
Data status and source confidence
BOUNDARY STANDARDIZEDNOT CLASS A CERTIFIEDNot Class A certified. 2 of six gates passed. No composite is shown: the controlled composite is withheld. How the six gates work.
Sources. Tenure and turnover: Texas Alcoholic Beverage Commission licenses and Texas Comptroller sales tax permits, joined to the parcel address. Ownership: Brazos CAD appraisal export, APPRAISAL_INFO.TXT. Residents and workers: 2020 Decennial Census P1_001N and LEHD LODES version 8.
On the boundary itself The smallest downtown in the register. The layer's own acreage field runs 2.9 percent over its geometry.
| Gate | Requirement | Disposition | Ledger code |
|---|---|---|---|
| G1 | Official district geometry | Passed | VERIFIED_PASS |
| G2 | Broad establishment universe | Refused on measurement: adopted footprint conflict | REFUSED_ON_MEASUREMENT_ADOPTED_FOOTPRINT_CONFLICT |
| G3 | Valid start history | Refused on measurement: adopted footprint conflict | REFUSED_ON_MEASUREMENT_ADOPTED_FOOTPRINT_CONFLICT |
| G4 | Valid trailing 48-month exit history | Refused on measurement: adopted footprint conflict | REFUSED_ON_MEASUREMENT_ADOPTED_FOOTPRINT_CONFLICT |
| G5 | Standardized ownership | Passed | VERIFIED_PASS |
| G6 | Harmonized context | Refused on measurement: adopted footprint conflict | REFUSED_ON_MEASUREMENT_ADOPTED_FOOTPRINT_CONFLICT |
Read on DTC Downtown Transit Center zoning, 172 acres, rung 1, adopted downtown zoning district or overlay. Adopted under City zoning district.
What this record means for a decision
Durability is tested in the Acquisition District Screen; who can act, in the District Capital Plan and the Ground-Floor Strategy.
HALL CAPITAL ADVISORY FINDINGHALL CAPITAL ADVISORY THRESHOLDAn interpretation of the bands below, not a score, a rank or advice.
Median years businesses have traded inside this boundary.
5.99 yearsTHINThe median across 26 businesses trading inside the line.Openings + closures per 100 starting businesses over four years.
WITHHELD39 ground-floor businesses stood inside this boundary at the start of the window, under the floor of 40. The reading is withheld rather than banded on that few.Ownership concentration: share of commercial accounts held by the largest private owner group.
4.08%NO STANDING147 commercial accounts resolving to 78 owner groups.Structural context · No band or score
Structural presence mix
Baseline Presence is the structural context the three readings are read against. It carries no band and no score. Residents are the 2020 Census count and workers the LODES workplace count, each apportioned to this boundary by block area, with anyone who both lives and works inside the line counted once. It is not a count of observed pedestrian activity. 26 of the 49 census blocks this boundary meets lie wholly inside it.
PUBLIC DATAHALL CAPITAL ADVISORY DERIVED2020 Decennial Census P1_001N and LEHD LODES version 8.
Data status and source confidence
BOUNDARY STANDARDIZEDNOT CLASS A CERTIFIEDPasses all six gates and is not Class A certified. Six passed gates is not certification. No composite is shown: the controlled composite is withheld. How the six gates work.
Sources. Tenure and turnover: Texas Alcoholic Beverage Commission licenses and Texas Comptroller sales tax permits, joined to the parcel address. Ownership: Dallas CAD certified roll, joined with the second county's roll. Residents and workers: 2020 Decennial Census P1_001N and LEHD LODES version 8.
On the boundary itself Zoning codes are stored parenthesised, so an equality match on DTC returns zero. The host path is /arcserver/. An ArcGIS Online search for Carrollton downtown returns four well-named layers that are Carrollton, Georgia.
| Gate | Requirement | Disposition | Ledger code |
|---|---|---|---|
| G1 | Official district geometry | Passed | VERIFIED_PASS |
| G2 | Broad establishment universe | Passed | VERIFIED_PASS |
| G3 | Valid start history | Passed | VERIFIED_PASS |
| G4 | Valid trailing 48-month exit history | Passed | VERIFIED_PASS |
| G5 | Standardized ownership | Passed | VERIFIED_PASS |
| G6 | Harmonized context | Passed | VERIFIED_PASS |
Read on Center City Municipal Service District, MSD 3, 132 acres, rung 3, downtown-purposed special district. Adopted under Charlotte MSD ordinance.
What this record means for a decision
Durability is tested in the Acquisition District Screen; who can act, in the District Capital Plan and the Ground-Floor Strategy.
HALL CAPITAL ADVISORY FINDINGHALL CAPITAL ADVISORY THRESHOLDAn interpretation of the bands below, not a score, a rank or advice.
Median years businesses have traded inside this boundary.
7.96 yearsSETTLINGprovisionalThe median across 76 businesses trading inside the line.Openings + closures per 100 starting businesses over four years.
WITHHELDNo register carrying a closing date covers this district.Ownership concentration: share of commercial accounts held by the largest private owner group.
3.94%A POSITION203 commercial accounts resolving to 120 owner groups.Structural context · No band or score
Structural presence mix
Baseline Presence is the structural context the three readings are read against. It carries no band and no score. Residents are the 2020 Census count and workers the LODES workplace count, each apportioned to this boundary by block area, with anyone who both lives and works inside the line counted once. It is not a count of observed pedestrian activity. 16 of the 56 census blocks this boundary meets lie wholly inside it.
PUBLIC DATAHALL CAPITAL ADVISORY DERIVED2020 Decennial Census P1_001N and LEHD LODES version 8.
Data status and source confidence
BOUNDARY STANDARDIZEDNOT CLASS A CERTIFIEDNot Class A certified. 3 of six gates passed. No composite is shown: the controlled composite is withheld. How the six gates work.
Sources. Tenure and turnover: North Carolina ABC Commission bulk permit export, Charlotte. Ownership: Mecklenburg County tax parcels with CAMA attributes. Residents and workers: 2020 Decennial Census P1_001N and LEHD LODES version 8.
| Gate | Requirement | Disposition | Ledger code |
|---|---|---|---|
| G1 | Official district geometry | Passed | VERIFIED_PASS |
| G2 | Broad establishment universe | Source unavailable | BLOCKED_SOURCE_UNAVAILABLE |
| G3 | Valid start history | Source unavailable | BLOCKED_SOURCE_UNAVAILABLE |
| G4 | Valid trailing 48-month exit history | Source unavailable | BLOCKED_SOURCE_UNAVAILABLE |
| G5 | Standardized ownership | Passed | VERIFIED_PASS |
| G6 | Harmonized context | Passed | VERIFIED_PASS |
Read on Downtown districts DC, DX, DR, DS, 1,590 acres, rung 1, adopted downtown zoning district or overlay. Adopted under Chicago Zoning Ordinance Title 17 Ch. 17-4.
What this record means for a decision
Durability is tested in the Acquisition District Screen; who can act, in the District Capital Plan and the Ground-Floor Strategy.
HALL CAPITAL ADVISORY FINDINGHALL CAPITAL ADVISORY THRESHOLDAn interpretation of the bands below, not a score, a rank or advice.
Median years businesses have traded inside this boundary.
7.12 yearsSETTLINGThe median across 3,626 businesses trading inside the line.Openings + closures per 100 starting businesses over four years.
102.5 per 100CHURNING2,018 opened and 2,652 closed against 4,558 ground-floor businesses at the start of the window.Ownership concentration: share of commercial accounts held by the largest private owner group.
6.48%NO STANDINGprovisional4,043 commercial accounts resolving to 1,491 owner groups.Structural context · No band or score
Structural presence mix
Baseline Presence is the structural context the three readings are read against. It carries no band and no score. Residents are the 2020 Census count and workers the LODES workplace count, each apportioned to this boundary by block area, with anyone who both lives and works inside the line counted once. It is not a count of observed pedestrian activity. 347 of the 1,085 census blocks this boundary meets lie wholly inside it.
PUBLIC DATAHALL CAPITAL ADVISORY DERIVED2020 Decennial Census P1_001N and LEHD LODES version 8.
Data status and source confidence
BOUNDARY STANDARDIZEDCERTIFICATION SUSPENDEDA strict peer holding 5 of six passes. Its membership is unchanged and its certification is suspended until it holds six admissible passes. No composite is shown: the controlled composite is withheld. How the six gates work.
Sources. Tenure and turnover: City of Chicago Business Licenses (r5kz-chrr). Ownership: Cook County Assessor Parcel Universe (pabr-t5kh) joined to Parcel Addresses (3723-97qp), tax year 2026. Residents and workers: 2020 Decennial Census P1_001N and LEHD LODES version 8.
| Gate | Requirement | Disposition | Ledger code |
|---|---|---|---|
| G1 | Official district geometry | Passed | VERIFIED_PASS |
| G2 | Broad establishment universe | Passed | VERIFIED_PASS |
| G3 | Valid start history | Passed | VERIFIED_PASS |
| G4 | Valid trailing 48-month exit history | Passed | VERIFIED_PASS |
| G5 | Standardized ownership | Refused on measurement: unreconciled account partition | REFUSED_ON_MEASUREMENT_UNRECONCILED_ACCOUNT_PARTITION |
| G6 | Harmonized context | Passed | VERIFIED_PASS |
Read on NG-1, NG-2 and NG-3 Northgate zoning, 142 acres, rung 1, adopted downtown zoning district or overlay. Adopted under Ordinance 2195 of 8 August 1996, amended 2572, 3530, 4329.
What this record means for a decision
Durability is tested in the Acquisition District Screen; who can act, in the District Capital Plan and the Ground-Floor Strategy.
HALL CAPITAL ADVISORY FINDINGHALL CAPITAL ADVISORY THRESHOLDAn interpretation of the bands below, not a score, a rank or advice.
Median years businesses have traded inside this boundary.
WITHHELD0 dated businesses sit inside this boundary, under the floor of 25. The reading is withheld rather than banded on that few.Openings + closures per 100 starting businesses over four years.
WITHHELD0 ground-floor businesses stood inside this boundary at the start of the window, under the floor of 40. The reading is withheld rather than banded on that few.Ownership concentration: share of commercial accounts held by the largest private owner group.
10.14%A POSITION69 commercial accounts resolving to 43 owner groups.Structural context · No band or score
Structural presence mix
Baseline Presence is the structural context the three readings are read against. It carries no band and no score. Residents are the 2020 Census count and workers the LODES workplace count, each apportioned to this boundary by block area, with anyone who both lives and works inside the line counted once. It is not a count of observed pedestrian activity. 14 of the 36 census blocks this boundary meets lie wholly inside it.
PUBLIC DATAHALL CAPITAL ADVISORY DERIVED2020 Decennial Census P1_001N and LEHD LODES version 8.
Data status and source confidence
BOUNDARY STANDARDIZEDNOT CLASS A CERTIFIEDNot Class A certified. 4 of six gates passed. No composite is shown: the controlled composite is withheld. How the six gates work.
Sources. Tenure and turnover: Texas Alcoholic Beverage Commission licenses and Texas Comptroller sales tax permits, joined to the parcel address. Ownership: Brazos CAD appraisal export, APPRAISAL_INFO.TXT. Residents and workers: 2020 Decennial Census P1_001N and LEHD LODES version 8.
On the boundary itself The stored values pad the hyphen with spaces on both sides. A match on NG-1 returns zero and raises nothing. The host path is /csgis/. The Northgate plan area is 340 acres, 2.4 times the regulated zoning.
| Gate | Requirement | Disposition | Ledger code |
|---|---|---|---|
| G1 | Official district geometry | Passed | VERIFIED_PASS |
| G2 | Broad establishment universe | Passed | VERIFIED_PASS |
| G3 | Valid start history | Failed its threshold | FAILED_THRESHOLD |
| G4 | Valid trailing 48-month exit history | Failed its threshold | FAILED_THRESHOLD |
| G5 | Standardized ownership | Passed | VERIFIED_PASS |
| G6 | Harmonized context | Passed | VERIFIED_PASS |
Read on Downtown District, 1,539 acres, rung 1, adopted downtown zoning district or overlay. Adopted under Columbus City Code Title 33 Ch. 3359.
What this record means for a decision
Durability is tested in the Acquisition District Screen; who can act, in the District Capital Plan and the Ground-Floor Strategy.
HALL CAPITAL ADVISORY FINDINGHALL CAPITAL ADVISORY THRESHOLDAn interpretation of the bands below, not a score, a rank or advice.
Median years businesses have traded inside this boundary.
WITHHELDNo dated business register covers this district.Openings + closures per 100 starting businesses over four years.
WITHHELDNo register carrying a closing date covers this district.Ownership concentration: share of commercial accounts held by the largest private owner group.
4.28%NO STANDING1,168 commercial accounts resolving to 390 owner groups.Structural context · No band or score
Structural presence mix
Baseline Presence is the structural context the three readings are read against. It carries no band and no score. Residents are the 2020 Census count and workers the LODES workplace count, each apportioned to this boundary by block area, with anyone who both lives and works inside the line counted once. It is not a count of observed pedestrian activity. 352 of the 403 census blocks this boundary meets lie wholly inside it.
PUBLIC DATAHALL CAPITAL ADVISORY DERIVED2020 Decennial Census P1_001N and LEHD LODES version 8.
Data status and source confidence
BOUNDARY STANDARDIZEDNOT CLASS A CERTIFIEDNot Class A certified. 3 of six gates passed. No composite is shown: the controlled composite is withheld. How the six gates work.
Sources. Tenure and turnover: NOT AVAILABLE. Ownership: Franklin County Auditor tax parcels. Residents and workers: 2020 Decennial Census P1_001N and LEHD LODES version 8.
| Gate | Requirement | Disposition | Ledger code |
|---|---|---|---|
| G1 | Official district geometry | Passed | VERIFIED_PASS |
| G2 | Broad establishment universe | Source unavailable | BLOCKED_SOURCE_UNAVAILABLE |
| G3 | Valid start history | Source unavailable | BLOCKED_SOURCE_UNAVAILABLE |
| G4 | Valid trailing 48-month exit history | Source unavailable | BLOCKED_SOURCE_UNAVAILABLE |
| G5 | Standardized ownership | Passed | VERIFIED_PASS |
| G6 | Harmonized context | Passed | VERIFIED_PASS |
Read on Downtown, Code section 14-601, 871 acres, rung 1, adopted downtown zoning district or overlay. Adopted under City of Conroe Code sections 14-601 and 14-602, effective 12 March 2020.
What this record means for a decision
Durability is tested in the Acquisition District Screen; who can act, in the District Capital Plan and the Ground-Floor Strategy.
HALL CAPITAL ADVISORY FINDINGHALL CAPITAL ADVISORY THRESHOLDAn interpretation of the bands below, not a score, a rank or advice.
Median years businesses have traded inside this boundary.
WITHHELD17 dated businesses sit inside this boundary, under the floor of 25. The reading is withheld rather than banded on that few.Openings + closures per 100 starting businesses over four years.
WITHHELD23 ground-floor businesses stood inside this boundary at the start of the window, under the floor of 40. The reading is withheld rather than banded on that few.Ownership concentration: share of commercial accounts held by the largest private owner group.
2.91%NO STANDINGprovisional412 commercial accounts resolving to 295 owner groups.Structural context · No band or score
Structural presence mix
Baseline Presence is the structural context the three readings are read against. It carries no band and no score. Residents are the 2020 Census count and workers the LODES workplace count, each apportioned to this boundary by block area, with anyone who both lives and works inside the line counted once. It is not a count of observed pedestrian activity. 162 of the 216 census blocks this boundary meets lie wholly inside it.
PUBLIC DATAHALL CAPITAL ADVISORY DERIVED2020 Decennial Census P1_001N and LEHD LODES version 8.
Data status and source confidence
BOUNDARY STANDARDIZEDNOT CLASS A CERTIFIEDNot Class A certified. 0 of six gates passed. No composite is shown: the controlled composite is withheld. How the six gates work.
Sources. Tenure and turnover: Texas Alcoholic Beverage Commission licenses and Texas Comptroller sales tax permits, joined to the parcel address. Ownership: Montgomery County IT-GIS Tax Parcel view, republishing the district. Residents and workers: 2020 Decennial Census P1_001N and LEHD LODES version 8.
On the boundary itself Conroe has no conventional zoning and publishes each code-defined district as a labelled polygon. The six section 14-602 sub-districts tile the section 14-601 downtown exactly, with no overlap and no gap, which is an unusually clean internal check. The host path is /cvharcgis/.
| Gate | Requirement | Disposition | Ledger code |
|---|---|---|---|
| G1 | Official district geometry | Source unavailable | BLOCKED_SOURCE_UNAVAILABLE |
| G2 | Broad establishment universe | Source unavailable | BLOCKED_SOURCE_UNAVAILABLE |
| G3 | Valid start history | Source unavailable | BLOCKED_SOURCE_UNAVAILABLE |
| G4 | Valid trailing 48-month exit history | Source unavailable | BLOCKED_SOURCE_UNAVAILABLE |
| G5 | Standardized ownership | Source unavailable | BLOCKED_SOURCE_UNAVAILABLE |
| G6 | Harmonized context | Source unavailable | BLOCKED_SOURCE_UNAVAILABLE |
Read on Reinvestment Zone Number 3, Downtown, 1,069 acres, rung 3, downtown-purposed special district. Adopted under Ordinance 27996 of 2008, boundaries expanded by Ordinance 028136 of 28 April 2009.
What this record means for a decision
Durability is tested in the Acquisition District Screen; who can act, in the District Capital Plan and the Ground-Floor Strategy.
HALL CAPITAL ADVISORY FINDINGHALL CAPITAL ADVISORY THRESHOLDAn interpretation of the bands below, not a score, a rank or advice.
Median years businesses have traded inside this boundary.
5.60 yearsTHINThe median across 29 businesses trading inside the line.Openings + closures per 100 starting businesses over four years.
58.5 per 100CYCLING14 opened and 10 closed against 41 ground-floor businesses at the start of the window.Ownership concentration: share of commercial accounts held by the largest private owner group.
4.11%NO STANDING365 commercial accounts resolving to 181 owner groups.Structural context · No band or score
Structural presence mix
Baseline Presence is the structural context the three readings are read against. It carries no band and no score. Residents are the 2020 Census count and workers the LODES workplace count, each apportioned to this boundary by block area, with anyone who both lives and works inside the line counted once. It is not a count of observed pedestrian activity. 158 of the 206 census blocks this boundary meets lie wholly inside it.
PUBLIC DATAHALL CAPITAL ADVISORY DERIVED2020 Decennial Census P1_001N and LEHD LODES version 8.
Data status and source confidence
BOUNDARY STANDARDIZEDNOT CLASS A CERTIFIEDPasses all six gates and is not Class A certified. Six passed gates is not certification. No composite is shown: the controlled composite is withheld. How the six gates work.
Sources. Tenure and turnover: Texas Alcoholic Beverage Commission licenses and Texas Comptroller sales tax permits, joined to the parcel address. Ownership: StratMap 2025, TxGIO, Nueces 48355. Residents and workers: 2020 Decennial Census P1_001N and LEHD LODES version 8.
On the boundary itself The city's stated 856 acres is the 2008 creation figure. It was superseded by the April 2009 expansion and never updated in the plan text, and it has been refiled unchanged in the Comptroller's biennial TIF registry for fifteen years. The polygon is the current boundary.
| Gate | Requirement | Disposition | Ledger code |
|---|---|---|---|
| G1 | Official district geometry | Passed | VERIFIED_PASS |
| G2 | Broad establishment universe | Passed | VERIFIED_PASS |
| G3 | Valid start history | Passed | VERIFIED_PASS |
| G4 | Valid trailing 48-month exit history | Passed | VERIFIED_PASS |
| G5 | Standardized ownership | Passed | VERIFIED_PASS |
| G6 | Harmonized context | Passed | VERIFIED_PASS |
Read on Downtown Improvement District, 1,043 acres, rung 3, downtown-purposed special district. Adopted under Chapter 372 public improvement district, created 1992, renewed to 31 December 2027.
What this record means for a decision
Durability is tested in the Acquisition District Screen; who can act, in the District Capital Plan and the Ground-Floor Strategy.
HALL CAPITAL ADVISORY FINDINGHALL CAPITAL ADVISORY THRESHOLDAn interpretation of the bands below, not a score, a rank or advice.
Median years businesses have traded inside this boundary.
4.93 yearsTHINThe median across 1,746 businesses trading inside the line.Openings + closures per 100 starting businesses over four years.
125.2 per 100CHURNING1,014 opened and 740 closed against 1,467 ground-floor businesses at the start of the window.Ownership concentration: share of commercial accounts held by the largest private owner group.
3.79%NO STANDING528 commercial accounts resolving to 258 owner groups.Structural context · No band or score
Structural presence mix
Baseline Presence is the structural context the three readings are read against. It carries no band and no score. Residents are the 2020 Census count and workers the LODES workplace count, each apportioned to this boundary by block area, with anyone who both lives and works inside the line counted once. It is not a count of observed pedestrian activity. 303 of the 368 census blocks this boundary meets lie wholly inside it.
PUBLIC DATAHALL CAPITAL ADVISORY DERIVED2020 Decennial Census P1_001N and LEHD LODES version 8.
Data status and source confidence
BOUNDARY STANDARDIZEDCLASS A CERTIFIEDHolds the governed Class A certification and passes all six gates. No composite is shown: the controlled composite is withheld. How the six gates work.
Sources. Tenure and turnover: Texas Alcoholic Beverage Commission licenses and Texas Comptroller sales tax permits, joined to the parcel address. Ownership: Dallas CAD certified roll, ACCOUNT_INFO.CSV. Residents and workers: 2020 Decennial Census P1_001N and LEHD LODES version 8.
On the boundary itself Dallas publishes no downtown zoning district, so the highest rung available is the improvement district.
| Gate | Requirement | Disposition | Ledger code |
|---|---|---|---|
| G1 | Official district geometry | Passed | VERIFIED_PASS |
| G2 | Broad establishment universe | Passed | VERIFIED_PASS |
| G3 | Valid start history | Passed | VERIFIED_PASS |
| G4 | Valid trailing 48-month exit history | Passed | VERIFIED_PASS |
| G5 | Standardized ownership | Passed | VERIFIED_PASS |
| G6 | Harmonized context | Passed | VERIFIED_PASS |
Read on Downtown Implementation Plan boundary, 203 acres, rung 2, adopted downtown plan area. Adopted under Council-adopted implementation plan.
What this record means for a decision
Durability is tested in the Acquisition District Screen; who can act, in the District Capital Plan and the Ground-Floor Strategy.
HALL CAPITAL ADVISORY FINDINGHALL CAPITAL ADVISORY THRESHOLDAn interpretation of the bands below, not a score, a rank or advice.
Median years businesses have traded inside this boundary.
4.16 yearsTHINThe median across 49 businesses trading inside the line.Openings + closures per 100 starting businesses over four years.
78.3 per 100REPLACING34 opened and 31 closed against 83 ground-floor businesses at the start of the window.Ownership concentration: share of commercial accounts held by the largest private owner group.
5.08%NO STANDING197 commercial accounts resolving to 115 owner groups.Structural context · No band or score
Structural presence mix
Baseline Presence is the structural context the three readings are read against. It carries no band and no score. Residents are the 2020 Census count and workers the LODES workplace count, each apportioned to this boundary by block area, with anyone who both lives and works inside the line counted once. It is not a count of observed pedestrian activity. 37 of the 71 census blocks this boundary meets lie wholly inside it.
PUBLIC DATAHALL CAPITAL ADVISORY DERIVED2020 Decennial Census P1_001N and LEHD LODES version 8.
Data status and source confidence
BOUNDARY STANDARDIZEDNOT CLASS A CERTIFIEDPasses all six gates and is not Class A certified. Six passed gates is not certification. No composite is shown: the controlled composite is withheld. How the six gates work.
Sources. Tenure and turnover: Texas Alcoholic Beverage Commission licenses and Texas Comptroller sales tax permits, joined to the parcel address. Ownership: StratMap 2025, TxGIO, Denton 48121. Residents and workers: 2020 Decennial Census P1_001N and LEHD LODES version 8.
On the boundary itself The Downtown Master Plan area is 382 acres, 1.9 times the implementation plan boundary. Denton publishes no downtown zoning district.
| Gate | Requirement | Disposition | Ledger code |
|---|---|---|---|
| G1 | Official district geometry | Passed | VERIFIED_PASS |
| G2 | Broad establishment universe | Passed | VERIFIED_PASS |
| G3 | Valid start history | Passed | VERIFIED_PASS |
| G4 | Valid trailing 48-month exit history | Passed | VERIFIED_PASS |
| G5 | Standardized ownership | Passed | VERIFIED_PASS |
| G6 | Harmonized context | Passed | VERIFIED_PASS |
Read on Downtown neighborhood context zone districts, 869 acres, rung 1, adopted downtown zoning district or overlay. Adopted under Denver Zoning Code 2010.
What this record means for a decision
Durability is tested in the Acquisition District Screen; who can act, in the District Capital Plan and the Ground-Floor Strategy.
HALL CAPITAL ADVISORY FINDINGHALL CAPITAL ADVISORY THRESHOLDAn interpretation of the bands below, not a score, a rank or advice.
Median years businesses have traded inside this boundary.
12.26 yearsSETTLINGprovisionalThe median across 246 businesses trading inside the line.Openings + closures per 100 starting businesses over four years.
37.2 per 100HELDprovisional52 opened and 25 closed against 207 ground-floor businesses at the start of the window.Ownership concentration: share of commercial accounts held by the largest private owner group.
1.36%NO STANDING1,401 commercial accounts resolving to 734 owner groups.Structural context · No band or score
Structural presence mix
Baseline Presence is the structural context the three readings are read against. It carries no band and no score. Residents are the 2020 Census count and workers the LODES workplace count, each apportioned to this boundary by block area, with anyone who both lives and works inside the line counted once. It is not a count of observed pedestrian activity. 159 of the 253 census blocks this boundary meets lie wholly inside it.
PUBLIC DATAHALL CAPITAL ADVISORY DERIVED2020 Decennial Census P1_001N and LEHD LODES version 8.
Data status and source confidence
BOUNDARY STANDARDIZEDNOT CLASS A CERTIFIEDNot Class A certified. 3 of six gates passed. No composite is shown: the controlled composite is withheld. How the six gates work.
Sources. Tenure and turnover: Denver Excise and Licenses, Liquor Licenses. Ownership: Denver Assessor parcels (ODC_PROP_PARCELS_A). Residents and workers: 2020 Decennial Census P1_001N and LEHD LODES version 8.
| Gate | Requirement | Disposition | Ledger code |
|---|---|---|---|
| G1 | Official district geometry | Passed | VERIFIED_PASS |
| G2 | Broad establishment universe | Source unavailable | BLOCKED_SOURCE_UNAVAILABLE |
| G3 | Valid start history | Source unavailable | BLOCKED_SOURCE_UNAVAILABLE |
| G4 | Valid trailing 48-month exit history | Source unavailable | BLOCKED_SOURCE_UNAVAILABLE |
| G5 | Standardized ownership | Passed | VERIFIED_PASS |
| G6 | Harmonized context | Passed | VERIFIED_PASS |
Read on Central Business District per the zoning ordinance, 955 acres, rung 1, adopted downtown zoning district or overlay. Adopted under Detroit City Code Chapter 50 (Zoning); polygon published by the City of Detroit as 'polygon of CBD per zoning ordinance'.
What this record means for a decision
Durability is tested in the Acquisition District Screen; who can act, in the District Capital Plan and the Ground-Floor Strategy.
HALL CAPITAL ADVISORY FINDINGHALL CAPITAL ADVISORY THRESHOLDAn interpretation of the bands below, not a score, a rank or advice.
Median years businesses have traded inside this boundary.
WITHHELDNo dated business register covers this district.Openings + closures per 100 starting businesses over four years.
WITHHELDNo register carrying a closing date covers this district.Ownership concentration: share of commercial accounts held by the largest private owner group.
4.57%NO STANDING503 commercial accounts resolving to 309 owner groups.Structural context · No band or score
Structural presence mix
Baseline Presence is the structural context the three readings are read against. It carries no band and no score. Residents are the 2020 Census count and workers the LODES workplace count, each apportioned to this boundary by block area, with anyone who both lives and works inside the line counted once. It is not a count of observed pedestrian activity. 271 of the 331 census blocks this boundary meets lie wholly inside it.
PUBLIC DATAHALL CAPITAL ADVISORY DERIVED2020 Decennial Census P1_001N and LEHD LODES version 8.
Data status and source confidence
BOUNDARY STANDARDIZEDNOT CLASS A CERTIFIEDNot Class A certified. 3 of six gates passed. No composite is shown: the controlled composite is withheld. How the six gates work.
Sources. Tenure and turnover: NOT AVAILABLE. Ownership: City of Detroit parcel file (parcel_file_current). Residents and workers: 2020 Decennial Census P1_001N and LEHD LODES version 8.
| Gate | Requirement | Disposition | Ledger code |
|---|---|---|---|
| G1 | Official district geometry | Passed | VERIFIED_PASS |
| G2 | Broad establishment universe | Source unavailable | BLOCKED_SOURCE_UNAVAILABLE |
| G3 | Valid start history | Source unavailable | BLOCKED_SOURCE_UNAVAILABLE |
| G4 | Valid trailing 48-month exit history | Source unavailable | BLOCKED_SOURCE_UNAVAILABLE |
| G5 | Standardized ownership | Passed | VERIFIED_PASS |
| G6 | Harmonized context | Passed | VERIFIED_PASS |
Read on DT Downtown zoning district, 120 acres, rung 1, adopted downtown zoning district or overlay. Adopted under Edinburg Unified Development Code, Ordinance 2020-4429 and Ordinance 2024-4972.
What this record means for a decision
Durability is tested in the Acquisition District Screen; who can act, in the District Capital Plan and the Ground-Floor Strategy.
HALL CAPITAL ADVISORY FINDINGHALL CAPITAL ADVISORY THRESHOLDAn interpretation of the bands below, not a score, a rank or advice.
Median years businesses have traded inside this boundary.
8.38 yearsSETTLINGThe median across 78 businesses trading inside the line.Openings + closures per 100 starting businesses over four years.
108.2 per 100CHURNING42 opened and 37 closed against 73 ground-floor businesses at the start of the window.Ownership concentration: share of commercial accounts held by the largest private owner group.
2.44%NO STANDING228 commercial accounts resolving to 147 owner groups.Structural context · No band or score
Structural presence mix
Baseline Presence is the structural context the three readings are read against. It carries no band and no score. Residents are the 2020 Census count and workers the LODES workplace count, each apportioned to this boundary by block area, with anyone who both lives and works inside the line counted once. It is not a count of observed pedestrian activity. 13 of the 65 census blocks this boundary meets lie wholly inside it.
PUBLIC DATAHALL CAPITAL ADVISORY DERIVED2020 Decennial Census P1_001N and LEHD LODES version 8.
Data status and source confidence
BOUNDARY DISPLAYED — PROVENANCE MIGRATION PENDINGCERTIFICATION SUSPENDEDA strict peer holding 5 of six passes. Its membership is unchanged and its certification is suspended until it holds six admissible passes. No composite is shown: the controlled composite is withheld. How the six gates work.
Sources. Tenure and turnover: Texas Alcoholic Beverage Commission licenses and Texas Comptroller sales tax permits, joined to the parcel address. Ownership: Hidalgo CAD parcel and appraisal export, HCADShapefiles. Residents and workers: 2020 Decennial Census P1_001N and LEHD LODES version 8.
On the boundary itself The layer is parcel-level with 33,686 features citywide and must be dissolved.
| Gate | Requirement | Disposition | Ledger code |
|---|---|---|---|
| G1 | Official district geometry | Passed | VERIFIED_PASS |
| G2 | Broad establishment universe | Passed | VERIFIED_PASS |
| G3 | Valid start history | Passed | VERIFIED_PASS |
| G4 | Valid trailing 48-month exit history | Passed | VERIFIED_PASS |
| G5 | Standardized ownership | Passed | VERIFIED_PASS |
| G6 | Harmonized context | Refused on measurement: adopted footprint conflict | REFUSED_ON_MEASUREMENT_ADOPTED_FOOTPRINT_CONFLICT |
Read on El Paso Downtown Management District, 303 acres, rung 3, downtown-purposed special district. Adopted under Texas Special District Local Laws Code Ch. 3972; coterminous with TIRZ 5.
What this record means for a decision
Durability is tested in the Acquisition District Screen; who can act, in the District Capital Plan and the Ground-Floor Strategy.
HALL CAPITAL ADVISORY FINDINGHALL CAPITAL ADVISORY THRESHOLDAn interpretation of the bands below, not a score, a rank or advice.
Median years businesses have traded inside this boundary.
7.10 yearsSETTLINGThe median across 483 businesses trading inside the line.Openings + closures per 100 starting businesses over four years.
104.5 per 100CHURNING252 opened and 232 closed against 463 ground-floor businesses at the start of the window.Ownership concentration: share of commercial accounts held by the largest private owner group.
5.01%NO STANDING439 commercial accounts resolving to 266 owner groups.Structural context · No band or score
Structural presence mix
Baseline Presence is the structural context the three readings are read against. It carries no band and no score. Residents are the 2020 Census count and workers the LODES workplace count, each apportioned to this boundary by block area, with anyone who both lives and works inside the line counted once. It is not a count of observed pedestrian activity. 101 of the 175 census blocks this boundary meets lie wholly inside it.
PUBLIC DATAHALL CAPITAL ADVISORY DERIVED2020 Decennial Census P1_001N and LEHD LODES version 8.
Data status and source confidence
BOUNDARY STANDARDIZEDNOT CLASS A CERTIFIEDPasses all six gates and is not Class A certified. Six passed gates is not certification. No composite is shown: the controlled composite is withheld. How the six gates work.
Sources. Tenure and turnover: Texas Comptroller, All Permitted Sales Tax Locations (3kx8-uryv). Ownership: City of El Paso parcels joined to the El Paso Central Appraisal District 2026 bulk roll. Residents and workers: 2020 Decennial Census P1_001N and LEHD LODES version 8.
| Gate | Requirement | Disposition | Ledger code |
|---|---|---|---|
| G1 | Official district geometry | Passed | VERIFIED_PASS |
| G2 | Broad establishment universe | Passed | VERIFIED_PASS |
| G3 | Valid start history | Passed | VERIFIED_PASS |
| G4 | Valid trailing 48-month exit history | Passed | VERIFIED_PASS |
| G5 | Standardized ownership | Passed | VERIFIED_PASS |
| G6 | Harmonized context | Passed | VERIFIED_PASS |
Read on H Central Business zoning district, 612 acres, rung 1, adopted downtown zoning district or overlay. Adopted under Fort Worth zoning ordinance; H is defined as restricted to the designated Central Business District.
What this record means for a decision
Durability is tested in the Acquisition District Screen; who can act, in the District Capital Plan and the Ground-Floor Strategy.
HALL CAPITAL ADVISORY FINDINGHALL CAPITAL ADVISORY THRESHOLDAn interpretation of the bands below, not a score, a rank or advice.
Median years businesses have traded inside this boundary.
4.65 yearsTHINThe median across 69 businesses trading inside the line.Openings + closures per 100 starting businesses over four years.
69.6 per 100CYCLING41 opened and 23 closed against 92 ground-floor businesses at the start of the window.Ownership concentration: share of commercial accounts held by the largest private owner group.
7.13%NO STANDING799 commercial accounts resolving to 306 owner groups.Structural context · No band or score
Structural presence mix
Baseline Presence is the structural context the three readings are read against. It carries no band and no score. Residents are the 2020 Census count and workers the LODES workplace count, each apportioned to this boundary by block area, with anyone who both lives and works inside the line counted once. It is not a count of observed pedestrian activity. 141 of the 291 census blocks this boundary meets lie wholly inside it.
PUBLIC DATAHALL CAPITAL ADVISORY DERIVED2020 Decennial Census P1_001N and LEHD LODES version 8.
Data status and source confidence
BOUNDARY STANDARDIZEDNOT CLASS A CERTIFIEDPasses all six gates and is not Class A certified. Six passed gates is not certification. No composite is shown: the controlled composite is withheld. How the six gates work.
Sources. Tenure and turnover: Texas Alcoholic Beverage Commission licenses and Texas Comptroller sales tax permits, joined to the parcel address. Ownership: Tarrant AD commercial roll, PropertyData(Delimited)_C.txt. Residents and workers: 2020 Decennial Census P1_001N and LEHD LODES version 8.
On the boundary itself Fort Worth's two earlier candidates, a design overlay at 982 acres and an improvement district at 537, are 1.8 times apart and neither is a base zoning district. H Central Business is, and it is the only instrument the city describes as the designated central business district. Its five candidates span 6.8 times.
| Gate | Requirement | Disposition | Ledger code |
|---|---|---|---|
| G1 | Official district geometry | Passed | VERIFIED_PASS |
| G2 | Broad establishment universe | Passed | VERIFIED_PASS |
| G3 | Valid start history | Passed | VERIFIED_PASS |
| G4 | Valid trailing 48-month exit history | Passed | VERIFIED_PASS |
| G5 | Standardized ownership | Passed | VERIFIED_PASS |
| G6 | Harmonized context | Passed | VERIFIED_PASS |
Read on Downtown Core, General and Neighborhood districts, 601 acres, rung 1, adopted downtown zoning district or overlay. Adopted under Fresno Municipal Code, Citywide Development Code Art. 15.
What this record means for a decision
Durability is tested in the Acquisition District Screen; who can act, in the District Capital Plan and the Ground-Floor Strategy.
HALL CAPITAL ADVISORY FINDINGHALL CAPITAL ADVISORY THRESHOLDAn interpretation of the bands below, not a score, a rank or advice.
Median years businesses have traded inside this boundary.
WITHHELDNo dated business register covers this district.Openings + closures per 100 starting businesses over four years.
WITHHELDNo register carrying a closing date covers this district.Ownership concentration: share of commercial accounts held by the largest private owner group.
WITHHELDNo owner name is published inside this boundary.Structural context · No band or score
Structural presence mix
Baseline Presence is the structural context the three readings are read against. It carries no band and no score. Residents are the 2020 Census count and workers the LODES workplace count, each apportioned to this boundary by block area, with anyone who both lives and works inside the line counted once. It is not a count of observed pedestrian activity. 83 of the 183 census blocks this boundary meets lie wholly inside it.
PUBLIC DATAHALL CAPITAL ADVISORY DERIVED2020 Decennial Census P1_001N and LEHD LODES version 8.
Data status and source confidence
BOUNDARY STANDARDIZEDNOT CLASS A CERTIFIEDNot Class A certified. 2 of six gates passed. No composite is shown: the controlled composite is withheld. How the six gates work.
Sources. Tenure and turnover: NOT AVAILABLE. Ownership: NOT AVAILABLE. Residents and workers: 2020 Decennial Census P1_001N and LEHD LODES version 8.
| Gate | Requirement | Disposition | Ledger code |
|---|---|---|---|
| G1 | Official district geometry | Passed | VERIFIED_PASS |
| G2 | Broad establishment universe | Refused on measurement: adopted footprint conflict | REFUSED_ON_MEASUREMENT_ADOPTED_FOOTPRINT_CONFLICT |
| G3 | Valid start history | Refused on measurement: adopted footprint conflict | REFUSED_ON_MEASUREMENT_ADOPTED_FOOTPRINT_CONFLICT |
| G4 | Valid trailing 48-month exit history | Refused on measurement: adopted footprint conflict | REFUSED_ON_MEASUREMENT_ADOPTED_FOOTPRINT_CONFLICT |
| G5 | Standardized ownership | Passed | VERIFIED_PASS |
| G6 | Harmonized context | Refused on measurement: adopted footprint conflict | REFUSED_ON_MEASUREMENT_ADOPTED_FOOTPRINT_CONFLICT |
Read on The Rail District, 246 acres, rung 3, downtown-purposed special district. Adopted under Rail District Investment Zone pilot program; the Rail District Advisory Board is codified.
What this record means for a decision
Durability is tested in the Acquisition District Screen; who can act, in the District Capital Plan and the Ground-Floor Strategy.
HALL CAPITAL ADVISORY FINDINGHALL CAPITAL ADVISORY THRESHOLDAn interpretation of the bands below, not a score, a rank or advice.
Median years businesses have traded inside this boundary.
WITHHELD13 dated businesses sit inside this boundary, under the floor of 25. The reading is withheld rather than banded on that few.Openings + closures per 100 starting businesses over four years.
WITHHELD17 ground-floor businesses stood inside this boundary at the start of the window, under the floor of 40. The reading is withheld rather than banded on that few.Ownership concentration: share of commercial accounts held by the largest private owner group.
2.78%NO STANDING180 commercial accounts resolving to 100 owner groups.Structural context · No band or score
Structural presence mix
Baseline Presence is the structural context the three readings are read against. It carries no band and no score. Residents are the 2020 Census count and workers the LODES workplace count, each apportioned to this boundary by block area, with anyone who both lives and works inside the line counted once. It is not a count of observed pedestrian activity. 37 of the 56 census blocks this boundary meets lie wholly inside it.
PUBLIC DATAHALL CAPITAL ADVISORY DERIVED2020 Decennial Census P1_001N and LEHD LODES version 8.
Data status and source confidence
BOUNDARY STANDARDIZEDNOT CLASS A CERTIFIEDPasses all six gates and is not Class A certified. Six passed gates is not certification. No composite is shown: the controlled composite is withheld. How the six gates work.
Sources. Tenure and turnover: Texas Alcoholic Beverage Commission licenses and Texas Comptroller sales tax permits, joined to the parcel address. Ownership: Collin CAD property roll, data.texas.gov 5tkr-3759. Residents and workers: 2020 Decennial Census P1_001N and LEHD LODES version 8.
On the boundary itself Frisco publishes no downtown zoning district. Its two improvement districts are Panther Creek and Frisco Square, neither of them the Rail District.
| Gate | Requirement | Disposition | Ledger code |
|---|---|---|---|
| G1 | Official district geometry | Passed | VERIFIED_PASS |
| G2 | Broad establishment universe | Passed | VERIFIED_PASS |
| G3 | Valid start history | Passed | VERIFIED_PASS |
| G4 | Valid trailing 48-month exit history | Passed | VERIFIED_PASS |
| G5 | Standardized ownership | Passed | VERIFIED_PASS |
| G6 | Harmonized context | Passed | VERIFIED_PASS |
Read on DT downtown zoning, 412 acres, rung 1, adopted downtown zoning district or overlay. Adopted under Per-parcel zoning ordinances carried in the data.
What this record means for a decision
Durability is tested in the Acquisition District Screen; who can act, in the District Capital Plan and the Ground-Floor Strategy.
HALL CAPITAL ADVISORY FINDINGHALL CAPITAL ADVISORY THRESHOLDAn interpretation of the bands below, not a score, a rank or advice.
Median years businesses have traded inside this boundary.
WITHHELD19 dated businesses sit inside this boundary, under the floor of 25. The reading is withheld rather than banded on that few.Openings + closures per 100 starting businesses over four years.
WITHHELD26 ground-floor businesses stood inside this boundary at the start of the window, under the floor of 40. The reading is withheld rather than banded on that few.Ownership concentration: share of commercial accounts held by the largest private owner group.
5.36%NO STANDING504 commercial accounts resolving to 252 owner groups.Structural context · No band or score
Structural presence mix
Baseline Presence is the structural context the three readings are read against. It carries no band and no score. Residents are the 2020 Census count and workers the LODES workplace count, each apportioned to this boundary by block area, with anyone who both lives and works inside the line counted once. It is not a count of observed pedestrian activity. 59 of the 129 census blocks this boundary meets lie wholly inside it.
PUBLIC DATAHALL CAPITAL ADVISORY DERIVED2020 Decennial Census P1_001N and LEHD LODES version 8.
Data status and source confidence
BOUNDARY STANDARDIZEDNOT CLASS A CERTIFIEDPasses all six gates and is not Class A certified. Six passed gates is not certification. No composite is shown: the controlled composite is withheld. How the six gates work.
Sources. Tenure and turnover: Texas Alcoholic Beverage Commission licenses and Texas Comptroller sales tax permits, joined to the parcel address. Ownership: Dallas CAD certified roll, ACCOUNT_INFO.CSV. Residents and workers: 2020 Decennial Census P1_001N and LEHD LODES version 8.
| Gate | Requirement | Disposition | Ledger code |
|---|---|---|---|
| G1 | Official district geometry | Passed | VERIFIED_PASS |
| G2 | Broad establishment universe | Passed | VERIFIED_PASS |
| G3 | Valid start history | Passed | VERIFIED_PASS |
| G4 | Valid trailing 48-month exit history | Passed | VERIFIED_PASS |
| G5 | Standardized ownership | Passed | VERIFIED_PASS |
| G6 | Harmonized context | Passed | VERIFIED_PASS |
Read on Downtown Overlay District, 118 acres, rung 1, adopted downtown zoning district or overlay. Adopted under Georgetown Unified Development Code chapter 4.
What this record means for a decision
Durability is tested in the Acquisition District Screen; who can act, in the District Capital Plan and the Ground-Floor Strategy.
HALL CAPITAL ADVISORY FINDINGHALL CAPITAL ADVISORY THRESHOLDAn interpretation of the bands below, not a score, a rank or advice.
Median years businesses have traded inside this boundary.
5.60 yearsTHINThe median across 41 businesses trading inside the line.Openings + closures per 100 starting businesses over four years.
56.6 per 100CYCLING18 opened and 12 closed against 53 ground-floor businesses at the start of the window.Ownership concentration: share of commercial accounts held by the largest private owner group.
5.17%NO STANDING174 commercial accounts resolving to 127 owner groups.Structural context · No band or score
Structural presence mix
Baseline Presence is the structural context the three readings are read against. It carries no band and no score. Residents are the 2020 Census count and workers the LODES workplace count, each apportioned to this boundary by block area, with anyone who both lives and works inside the line counted once. It is not a count of observed pedestrian activity. 27 of the 64 census blocks this boundary meets lie wholly inside it.
PUBLIC DATAHALL CAPITAL ADVISORY DERIVED2020 Decennial Census P1_001N and LEHD LODES version 8.
Data status and source confidence
BOUNDARY STANDARDIZEDNOT CLASS A CERTIFIEDPasses all six gates and is not Class A certified. Six passed gates is not certification. No composite is shown: the controlled composite is withheld. How the six gates work.
Sources. Tenure and turnover: Texas Alcoholic Beverage Commission licenses and Texas Comptroller sales tax permits, joined to the parcel address. Ownership: Williamson CAD open data, PropOwner and PropertyDataExport. Residents and workers: 2020 Decennial Census P1_001N and LEHD LODES version 8.
On the boundary itself The same geometry is mirrored under the name Downtown Overlay Area 2. The Main Street boundary is 334 acres, 2.8 times the overlay.
| Gate | Requirement | Disposition | Ledger code |
|---|---|---|---|
| G1 | Official district geometry | Passed | VERIFIED_PASS |
| G2 | Broad establishment universe | Passed | VERIFIED_PASS |
| G3 | Valid start history | Passed | VERIFIED_PASS |
| G4 | Valid trailing 48-month exit history | Passed | VERIFIED_PASS |
| G5 | Standardized ownership | Passed | VERIFIED_PASS |
| G6 | Harmonized context | Passed | VERIFIED_PASS |
Read on Central Business District, four sub-districts, 2,307 acres, rung 1, adopted downtown zoning district or overlay. Adopted under City zoning, Appendix R of the code.
What this record means for a decision
Durability is tested in the Acquisition District Screen; who can act, in the District Capital Plan and the Ground-Floor Strategy.
HALL CAPITAL ADVISORY FINDINGHALL CAPITAL ADVISORY THRESHOLDAn interpretation of the bands below, not a score, a rank or advice.
Median years businesses have traded inside this boundary.
5.02 yearsTHINThe median across 42 businesses trading inside the line.Openings + closures per 100 starting businesses over four years.
62.7 per 100CYCLING22 opened and 20 closed against 67 ground-floor businesses at the start of the window.Ownership concentration: share of commercial accounts held by the largest private owner group.
1.89%NO STANDING1,379 commercial accounts resolving to 691 owner groups.Structural context · No band or score
Structural presence mix
Baseline Presence is the structural context the three readings are read against. It carries no band and no score. Residents are the 2020 Census count and workers the LODES workplace count, each apportioned to this boundary by block area, with anyone who both lives and works inside the line counted once. It is not a count of observed pedestrian activity. 238 of the 397 census blocks this boundary meets lie wholly inside it.
PUBLIC DATAHALL CAPITAL ADVISORY DERIVED2020 Decennial Census P1_001N and LEHD LODES version 8.
Data status and source confidence
BOUNDARY STANDARDIZEDNOT CLASS A CERTIFIEDPasses all six gates and is not Class A certified. Six passed gates is not certification. No composite is shown: the controlled composite is withheld. How the six gates work.
Sources. Tenure and turnover: Texas Alcoholic Beverage Commission licenses and Texas Comptroller sales tax permits, joined to the parcel address. Ownership: Dallas CAD certified roll and Tarrant AD commercial roll. Residents and workers: 2020 Decennial Census P1_001N and LEHD LODES version 8.
On the boundary itself The adopted CBD bundles an industrial sub-district of 487 acres and an automotive sub-district of 1,145, which is why it is the largest boundary in the register. District No 2, the government and retail core, is 373 acres on its own. The district as adopted is what is measured.
| Gate | Requirement | Disposition | Ledger code |
|---|---|---|---|
| G1 | Official district geometry | Passed | VERIFIED_PASS |
| G2 | Broad establishment universe | Passed | VERIFIED_PASS |
| G3 | Valid start history | Passed | VERIFIED_PASS |
| G4 | Valid trailing 48-month exit history | Passed | VERIFIED_PASS |
| G5 | Standardized ownership | Passed | VERIFIED_PASS |
| G6 | Harmonized context | Passed | VERIFIED_PASS |
Read on DT-1, DT-2 and DT-3 Downtown districts, 215 acres, rung 1, adopted downtown zoning district or overlay. Adopted under City of Hartford Zoning Regulations, effective 19 January 2016.
What this record means for a decision
Durability is tested in the Acquisition District Screen; who can act, in the District Capital Plan and the Ground-Floor Strategy.
HALL CAPITAL ADVISORY FINDINGHALL CAPITAL ADVISORY THRESHOLDAn interpretation of the bands below, not a score, a rank or advice.
Median years businesses have traded inside this boundary.
6.78 yearsSETTLINGprovisionalThe median across 261 businesses trading inside the line.Openings + closures per 100 starting businesses over four years.
107.4 per 100CHURNINGprovisional141 opened and 107 closed against 231 ground-floor businesses at the start of the window.Ownership concentration: share of commercial accounts held by the largest private owner group.
10.53%A POSITION133 commercial accounts resolving to 85 owner groups.Structural context · No band or score
Structural presence mix
Baseline Presence is the structural context the three readings are read against. It carries no band and no score. Residents are the 2020 Census count and workers the LODES workplace count, each apportioned to this boundary by block area, with anyone who both lives and works inside the line counted once. It is not a count of observed pedestrian activity. 12 of the 71 census blocks this boundary meets lie wholly inside it.
PUBLIC DATAHALL CAPITAL ADVISORY DERIVED2020 Decennial Census P1_001N and LEHD LODES version 8.
Data status and source confidence
BOUNDARY STANDARDIZEDNOT CLASS A CERTIFIEDNot Class A certified. 2 of six gates passed. No composite is shown: the controlled composite is withheld. How the six gates work.
Sources. Tenure and turnover: Connecticut State Licenses and Credentials master export (ngch-56tr). Ownership: Connecticut statewide parcel and CAMA layer, town of Hartford. Residents and workers: 2020 Decennial Census P1_001N and LEHD LODES version 8.
| Gate | Requirement | Disposition | Ledger code |
|---|---|---|---|
| G1 | Official district geometry | Passed | VERIFIED_PASS |
| G2 | Broad establishment universe | Refused on measurement: adopted footprint conflict | REFUSED_ON_MEASUREMENT_ADOPTED_FOOTPRINT_CONFLICT |
| G3 | Valid start history | Refused on measurement: adopted footprint conflict | REFUSED_ON_MEASUREMENT_ADOPTED_FOOTPRINT_CONFLICT |
| G4 | Valid trailing 48-month exit history | Refused on measurement: adopted footprint conflict | REFUSED_ON_MEASUREMENT_ADOPTED_FOOTPRINT_CONFLICT |
| G5 | Standardized ownership | Passed | VERIFIED_PASS |
| G6 | Harmonized context | Refused on measurement: adopted footprint conflict | REFUSED_ON_MEASUREMENT_ADOPTED_FOOTPRINT_CONFLICT |
Read on Houston Downtown Management District, 1,170 acres, rung 3, downtown-purposed special district. Adopted under Senate Bill 1620, 74th Legislature 1995, now Special District Local Laws Code chapter 3801.
What this record means for a decision
Durability is tested in the Acquisition District Screen; who can act, in the District Capital Plan and the Ground-Floor Strategy.
HALL CAPITAL ADVISORY FINDINGHALL CAPITAL ADVISORY THRESHOLDAn interpretation of the bands below, not a score, a rank or advice.
Median years businesses have traded inside this boundary.
6.24 yearsSETTLINGThe median across 107 businesses trading inside the line.Openings + closures per 100 starting businesses over four years.
56.0 per 100CYCLING45 opened and 44 closed against 159 ground-floor businesses at the start of the window.Ownership concentration: share of commercial accounts held by the largest private owner group.
3.46%NO STANDING492 commercial accounts resolving to 261 owner groups.Structural context · No band or score
Structural presence mix
Baseline Presence is the structural context the three readings are read against. It carries no band and no score. Residents are the 2020 Census count and workers the LODES workplace count, each apportioned to this boundary by block area, with anyone who both lives and works inside the line counted once. It is not a count of observed pedestrian activity. 351 of the 433 census blocks this boundary meets lie wholly inside it.
PUBLIC DATAHALL CAPITAL ADVISORY DERIVED2020 Decennial Census P1_001N and LEHD LODES version 8.
Data status and source confidence
BOUNDARY STANDARDIZEDNOT CLASS A CERTIFIEDPasses all six gates and is not Class A certified. Six passed gates is not certification. No composite is shown: the controlled composite is withheld. How the six gates work.
Sources. Tenure and turnover: Texas Alcoholic Beverage Commission licenses and Texas Comptroller sales tax permits, joined to the parcel address. Ownership: Harris CAD certified roll, real_acct.txt. Residents and workers: 2020 Decennial Census P1_001N and LEHD LODES version 8.
On the boundary itself Houston has no zoning at all, so rungs 1 and 2 cannot exist there. The management district is the highest rung the city can reach.
| Gate | Requirement | Disposition | Ledger code |
|---|---|---|---|
| G1 | Official district geometry | Passed | VERIFIED_PASS |
| G2 | Broad establishment universe | Passed | VERIFIED_PASS |
| G3 | Valid start history | Passed | VERIFIED_PASS |
| G4 | Valid trailing 48-month exit history | Passed | VERIFIED_PASS |
| G5 | Standardized ownership | Passed | VERIFIED_PASS |
| G6 | Harmonized context | Passed | VERIFIED_PASS |
Read on Regional Center, 4,422 acres, rung 2, adopted downtown plan area. Adopted under Indianapolis-Marion County Consolidated Zoning and Subdivision Ordinance, Regional Center.
What this record means for a decision
Durability is tested in the Acquisition District Screen; who can act, in the District Capital Plan and the Ground-Floor Strategy.
HALL CAPITAL ADVISORY FINDINGHALL CAPITAL ADVISORY THRESHOLDAn interpretation of the bands below, not a score, a rank or advice.
Median years businesses have traded inside this boundary.
WITHHELDNo dated business register covers this district.Openings + closures per 100 starting businesses over four years.
WITHHELDNo register carrying a closing date covers this district.Ownership concentration: share of commercial accounts held by the largest private owner group.
7.80%NO STANDING1,435 commercial accounts resolving to 722 owner groups.Structural context · No band or score
Structural presence mix
Baseline Presence is the structural context the three readings are read against. It carries no band and no score. Residents are the 2020 Census count and workers the LODES workplace count, each apportioned to this boundary by block area, with anyone who both lives and works inside the line counted once. It is not a count of observed pedestrian activity. 852 of the 992 census blocks this boundary meets lie wholly inside it.
PUBLIC DATAHALL CAPITAL ADVISORY DERIVED2020 Decennial Census P1_001N and LEHD LODES version 8.
Data status and source confidence
BOUNDARY STANDARDIZEDNOT CLASS A CERTIFIEDNot Class A certified. 3 of six gates passed. No composite is shown: the controlled composite is withheld. How the six gates work.
Sources. Tenure and turnover: NOT AVAILABLE. Ownership: Marion County parcels via MapIndy property service. Residents and workers: 2020 Decennial Census P1_001N and LEHD LODES version 8.
| Gate | Requirement | Disposition | Ledger code |
|---|---|---|---|
| G1 | Official district geometry | Passed | VERIFIED_PASS |
| G2 | Broad establishment universe | Source unavailable | BLOCKED_SOURCE_UNAVAILABLE |
| G3 | Valid start history | Source unavailable | BLOCKED_SOURCE_UNAVAILABLE |
| G4 | Valid trailing 48-month exit history | Source unavailable | BLOCKED_SOURCE_UNAVAILABLE |
| G5 | Standardized ownership | Passed | VERIFIED_PASS |
| G6 | Harmonized context | Passed | VERIFIED_PASS |
Read on Downtown Development District overlay, 174 acres, rung 1, adopted downtown zoning district or overlay. Adopted under City overlay district.
What this record means for a decision
Durability is tested in the Acquisition District Screen; who can act, in the District Capital Plan and the Ground-Floor Strategy.
HALL CAPITAL ADVISORY FINDINGHALL CAPITAL ADVISORY THRESHOLDAn interpretation of the bands below, not a score, a rank or advice.
Median years businesses have traded inside this boundary.
WITHHELD8 dated businesses sit inside this boundary, under the floor of 25. The reading is withheld rather than banded on that few.Openings + closures per 100 starting businesses over four years.
WITHHELD8 ground-floor businesses stood inside this boundary at the start of the window, under the floor of 40. The reading is withheld rather than banded on that few.Ownership concentration: share of commercial accounts held by the largest private owner group.
6.54%NO STANDING153 commercial accounts resolving to 88 owner groups.Structural context · No band or score
Structural presence mix
Baseline Presence is the structural context the three readings are read against. It carries no band and no score. Residents are the 2020 Census count and workers the LODES workplace count, each apportioned to this boundary by block area, with anyone who both lives and works inside the line counted once. It is not a count of observed pedestrian activity. 18 of the 53 census blocks this boundary meets lie wholly inside it.
PUBLIC DATAHALL CAPITAL ADVISORY DERIVED2020 Decennial Census P1_001N and LEHD LODES version 8.
Data status and source confidence
BOUNDARY STANDARDIZEDNOT CLASS A CERTIFIEDPasses all six gates and is not Class A certified. Six passed gates is not certification. No composite is shown: the controlled composite is withheld. How the six gates work.
Sources. Tenure and turnover: Texas Alcoholic Beverage Commission licenses and Texas Comptroller sales tax permits, joined to the parcel address. Ownership: Dallas CAD certified roll, ACCOUNT_INFO.CSV. Residents and workers: 2020 Decennial Census P1_001N and LEHD LODES version 8.
On the boundary itself Irving's TIRZ 1 is 3,680 acres and is Las Colinas, not downtown. Not substituted.
| Gate | Requirement | Disposition | Ledger code |
|---|---|---|---|
| G1 | Official district geometry | Passed | VERIFIED_PASS |
| G2 | Broad establishment universe | Passed | VERIFIED_PASS |
| G3 | Valid start history | Passed | VERIFIED_PASS |
| G4 | Valid trailing 48-month exit history | Passed | VERIFIED_PASS |
| G5 | Standardized ownership | Passed | VERIFIED_PASS |
| G6 | Harmonized context | Passed | VERIFIED_PASS |
Read on Downtown Overlay Zone, 2,480 acres, rung 1, adopted downtown zoning district or overlay. Adopted under Jacksonville Ordinance Code Part 3 Chapter 656.
What this record means for a decision
Durability is tested in the Acquisition District Screen; who can act, in the District Capital Plan and the Ground-Floor Strategy.
HALL CAPITAL ADVISORY FINDINGHALL CAPITAL ADVISORY THRESHOLDAn interpretation of the bands below, not a score, a rank or advice.
Median years businesses have traded inside this boundary.
5.72 yearsTHINprovisionalThe median across 55 businesses trading inside the line.Openings + closures per 100 starting businesses over four years.
WITHHELDNo register carrying a closing date covers this district.Ownership concentration: share of commercial accounts held by the largest private owner group.
9.38%A POSITION832 commercial accounts resolving to 350 owner groups.Structural context · No band or score
Structural presence mix
Baseline Presence is the structural context the three readings are read against. It carries no band and no score. Residents are the 2020 Census count and workers the LODES workplace count, each apportioned to this boundary by block area, with anyone who both lives and works inside the line counted once. It is not a count of observed pedestrian activity. 318 of the 389 census blocks this boundary meets lie wholly inside it.
PUBLIC DATAHALL CAPITAL ADVISORY DERIVED2020 Decennial Census P1_001N and LEHD LODES version 8.
Data status and source confidence
BOUNDARY STANDARDIZEDNOT CLASS A CERTIFIEDNot Class A certified. 3 of six gates passed. No composite is shown: the controlled composite is withheld. How the six gates work.
Sources. Tenure and turnover: Florida DBPR Division of Alcoholic Beverages and Tobacco master licensee file (bd400lic). Ownership: Florida Statewide Cadastral, FGIO and FDOR, county 26. Residents and workers: 2020 Decennial Census P1_001N and LEHD LODES version 8.
| Gate | Requirement | Disposition | Ledger code |
|---|---|---|---|
| G1 | Official district geometry | Passed | VERIFIED_PASS |
| G2 | Broad establishment universe | Source unavailable | BLOCKED_SOURCE_UNAVAILABLE |
| G3 | Valid start history | Source unavailable | BLOCKED_SOURCE_UNAVAILABLE |
| G4 | Valid trailing 48-month exit history | Source unavailable | BLOCKED_SOURCE_UNAVAILABLE |
| G5 | Standardized ownership | Passed | VERIFIED_PASS |
| G6 | Harmonized context | Passed | VERIFIED_PASS |
Read on Downtown KC Community Improvement District, 491 acres, rung 3, downtown-purposed special district. Adopted under Mo. Rev. Stat. sec. 67.1401 et seq., administered by the Downtown Council.
What this record means for a decision
Durability is tested in the Acquisition District Screen; who can act, in the District Capital Plan and the Ground-Floor Strategy.
HALL CAPITAL ADVISORY FINDINGHALL CAPITAL ADVISORY THRESHOLDAn interpretation of the bands below, not a score, a rank or advice.
Median years businesses have traded inside this boundary.
WITHHELDNo dated business register covers this district.Openings + closures per 100 starting businesses over four years.
WITHHELDNo register carrying a closing date covers this district.Ownership concentration: share of commercial accounts held by the largest private owner group.
34.20%NO STANDING614 commercial accounts resolving to 155 owner groups.Structural context · No band or score
Structural presence mix
Baseline Presence is the structural context the three readings are read against. It carries no band and no score. Residents are the 2020 Census count and workers the LODES workplace count, each apportioned to this boundary by block area, with anyone who both lives and works inside the line counted once. It is not a count of observed pedestrian activity. 143 of the 185 census blocks this boundary meets lie wholly inside it.
PUBLIC DATAHALL CAPITAL ADVISORY DERIVED2020 Decennial Census P1_001N and LEHD LODES version 8.
Data status and source confidence
BOUNDARY STANDARDIZEDNOT CLASS A CERTIFIEDNot Class A certified. 4 of six gates passed. No composite is shown: the controlled composite is withheld. How the six gates work.
Sources. Tenure and turnover: NOT AVAILABLE. Ownership: Jackson County Assessment parcels joined to the Ascend roll. Residents and workers: 2020 Decennial Census P1_001N and LEHD LODES version 8.
| Gate | Requirement | Disposition | Ledger code |
|---|---|---|---|
| G1 | Official district geometry | Passed | VERIFIED_PASS |
| G2 | Broad establishment universe | Passed | VERIFIED_PASS |
| G3 | Valid start history | Source unavailable | BLOCKED_SOURCE_UNAVAILABLE |
| G4 | Valid trailing 48-month exit history | Source unavailable | BLOCKED_SOURCE_UNAVAILABLE |
| G5 | Standardized ownership | Passed | VERIFIED_PASS |
| G6 | Harmonized context | Passed | VERIFIED_PASS |
Read on Historical Downtown overlay, 20 acres, rung 4, Main Street or historic district. Adopted under Ordinance 22-046, Chapter 31 Division 17.
What this record means for a decision
Durability is tested in the Acquisition District Screen; who can act, in the District Capital Plan and the Ground-Floor Strategy.
HALL CAPITAL ADVISORY FINDINGHALL CAPITAL ADVISORY THRESHOLDAn interpretation of the bands below, not a score, a rank or advice.
Median years businesses have traded inside this boundary.
WITHHELD4 dated businesses sit inside this boundary, under the floor of 25. The reading is withheld rather than banded on that few.Openings + closures per 100 starting businesses over four years.
WITHHELD5 ground-floor businesses stood inside this boundary at the start of the window, under the floor of 40. The reading is withheld rather than banded on that few.Ownership concentration: share of commercial accounts held by the largest private owner group.
5.81%NO STANDING86 commercial accounts resolving to 66 owner groups.Structural context · No band or score
Structural presence mix
Baseline Presence is the structural context the three readings are read against. It carries no band and no score. Residents are the 2020 Census count and workers the LODES workplace count, each apportioned to this boundary by block area, with anyone who both lives and works inside the line counted once. It is not a count of observed pedestrian activity. 4 of the 18 census blocks this boundary meets lie wholly inside it.
PUBLIC DATAHALL CAPITAL ADVISORY DERIVED2020 Decennial Census P1_001N and LEHD LODES version 8.
Data status and source confidence
BOUNDARY STANDARDIZEDNOT CLASS A CERTIFIEDNot Class A certified. 5 of six gates passed. No composite is shown: the controlled composite is withheld. How the six gates work.
Sources. Tenure and turnover: Texas Alcoholic Beverage Commission licenses and Texas Comptroller sales tax permits, joined to the parcel address. Ownership: StratMap 2025, TxGIO, Bell 48027. Residents and workers: 2020 Decennial Census P1_001N and LEHD LODES version 8.
On the boundary itself Killeen's downtown commercial zoning is scattered over eight miles and is not a contiguous district. The TIRZ is 2,471 acres along five and a half miles of Business 190. The historic overlay is the only downtown-specific boundary the city publishes, and it is small. Killeen was designated a Texas Main Street city in 2025 but is not yet in the Historical Commission's boundary layer.
| Gate | Requirement | Disposition | Ledger code |
|---|---|---|---|
| G1 | Official district geometry | Passed | VERIFIED_PASS |
| G2 | Broad establishment universe | Passed | VERIFIED_PASS |
| G3 | Valid start history | Passed | VERIFIED_PASS |
| G4 | Valid trailing 48-month exit history | Failed its threshold | FAILED_THRESHOLD |
| G5 | Standardized ownership | Passed | VERIFIED_PASS |
| G6 | Harmonized context | Passed | VERIFIED_PASS |
Read on CBD zoning district, 112 acres, rung 1, adopted downtown zoning district or overlay. Adopted under Ordinance 83-O-0067 of 1983, amended 94-O-245, 2002-O-060, 2018-O-064, 2018-O-101.
What this record means for a decision
Durability is tested in the Acquisition District Screen; who can act, in the District Capital Plan and the Ground-Floor Strategy.
HALL CAPITAL ADVISORY FINDINGHALL CAPITAL ADVISORY THRESHOLDAn interpretation of the bands below, not a score, a rank or advice.
Median years businesses have traded inside this boundary.
WITHHELD24 dated businesses sit inside this boundary, under the floor of 25. The reading is withheld rather than banded on that few.Openings + closures per 100 starting businesses over four years.
87.5 per 100CHURNING21 opened and 14 closed against 40 ground-floor businesses at the start of the window.Ownership concentration: share of commercial accounts held by the largest private owner group.
5.08%NO STANDING256 commercial accounts resolving to 146 owner groups.Structural context · No band or score
Structural presence mix
Baseline Presence is the structural context the three readings are read against. It carries no band and no score. Residents are the 2020 Census count and workers the LODES workplace count, each apportioned to this boundary by block area, with anyone who both lives and works inside the line counted once. It is not a count of observed pedestrian activity. 28 of the 85 census blocks this boundary meets lie wholly inside it.
PUBLIC DATAHALL CAPITAL ADVISORY DERIVED2020 Decennial Census P1_001N and LEHD LODES version 8.
Data status and source confidence
BOUNDARY STANDARDIZEDNOT CLASS A CERTIFIEDPasses all six gates and is not Class A certified. Six passed gates is not certification. No composite is shown: the controlled composite is withheld. How the six gates work.
Sources. Tenure and turnover: Texas Alcoholic Beverage Commission licenses and Texas Comptroller sales tax permits, joined to the parcel address. Ownership: StratMap 2025, TxGIO, Webb 48479. Residents and workers: 2020 Decennial Census P1_001N and LEHD LODES version 8.
| Gate | Requirement | Disposition | Ledger code |
|---|---|---|---|
| G1 | Official district geometry | Passed | VERIFIED_PASS |
| G2 | Broad establishment universe | Passed | VERIFIED_PASS |
| G3 | Valid start history | Passed | VERIFIED_PASS |
| G4 | Valid trailing 48-month exit history | Passed | VERIFIED_PASS |
| G5 | Standardized ownership | Passed | VERIFIED_PASS |
| G6 | Harmonized context | Passed | VERIFIED_PASS |
Read on Downtown Las Vegas Overlay District, 3,061 acres, rung 1, adopted downtown zoning district or overlay. Adopted under Las Vegas Municipal Code Title 19.09, form based code.
What this record means for a decision
Durability is tested in the Acquisition District Screen; who can act, in the District Capital Plan and the Ground-Floor Strategy.
HALL CAPITAL ADVISORY FINDINGHALL CAPITAL ADVISORY THRESHOLDAn interpretation of the bands below, not a score, a rank or advice.
Median years businesses have traded inside this boundary.
5.60 yearsTHINprovisionalThe median across 5,127 businesses trading inside the line.Openings + closures per 100 starting businesses over four years.
135.3 per 100CHURNINGprovisional3,403 opened and 3,239 closed against 4,910 ground-floor businesses at the start of the window.Ownership concentration: share of commercial accounts held by the largest private owner group.
4.54%NO STANDINGprovisional1,608 commercial accounts resolving to 930 owner groups.Structural context · No band or score
Structural presence mix
Baseline Presence is the structural context the three readings are read against. It carries no band and no score. Residents are the 2020 Census count and workers the LODES workplace count, each apportioned to this boundary by block area, with anyone who both lives and works inside the line counted once. It is not a count of observed pedestrian activity. 414 of the 511 census blocks this boundary meets lie wholly inside it.
PUBLIC DATAHALL CAPITAL ADVISORY DERIVED2020 Decennial Census P1_001N and LEHD LODES version 8.
Data status and source confidence
BOUNDARY STANDARDIZEDNOT CLASS A CERTIFIEDNot Class A certified. 2 of six gates passed. No composite is shown: the controlled composite is withheld. How the six gates work.
Sources. Tenure and turnover: City of Las Vegas business licenses (LIVE_CLV_BUS). Ownership: Clark County Assessor secured roll extract, joined to the county parcel layer for the mailing address. Residents and workers: 2020 Decennial Census P1_001N and LEHD LODES version 8.
| Gate | Requirement | Disposition | Ledger code |
|---|---|---|---|
| G1 | Official district geometry | Passed | VERIFIED_PASS |
| G2 | Broad establishment universe | Source unavailable | BLOCKED_SOURCE_UNAVAILABLE |
| G3 | Valid start history | Source unavailable | BLOCKED_SOURCE_UNAVAILABLE |
| G4 | Valid trailing 48-month exit history | Source unavailable | BLOCKED_SOURCE_UNAVAILABLE |
| G5 | Standardized ownership | Source unavailable | BLOCKED_SOURCE_UNAVAILABLE |
| G6 | Harmonized context | Passed | VERIFIED_PASS |
Read on Olde Towne and Olde Towne Transition zoning, 35 acres, rung 1, adopted downtown zoning district or overlay. Adopted under City zoning districts.
What this record means for a decision
Durability is tested in the Acquisition District Screen; who can act, in the District Capital Plan and the Ground-Floor Strategy.
HALL CAPITAL ADVISORY FINDINGHALL CAPITAL ADVISORY THRESHOLDAn interpretation of the bands below, not a score, a rank or advice.
Median years businesses have traded inside this boundary.
WITHHELD5 dated businesses sit inside this boundary, under the floor of 25. The reading is withheld rather than banded on that few.Openings + closures per 100 starting businesses over four years.
WITHHELD9 ground-floor businesses stood inside this boundary at the start of the window, under the floor of 40. The reading is withheld rather than banded on that few.Ownership concentration: share of commercial accounts held by the largest private owner group.
5.66%NO STANDING53 commercial accounts resolving to 39 owner groups.Structural context · No band or score
Structural presence mix
Baseline Presence is the structural context the three readings are read against. It carries no band and no score. Residents are the 2020 Census count and workers the LODES workplace count, each apportioned to this boundary by block area, with anyone who both lives and works inside the line counted once. It is not a count of observed pedestrian activity. 4 of the 25 census blocks this boundary meets lie wholly inside it.
PUBLIC DATAHALL CAPITAL ADVISORY DERIVED2020 Decennial Census P1_001N and LEHD LODES version 8.
Data status and source confidence
BOUNDARY STANDARDIZEDNOT CLASS A CERTIFIEDNot Class A certified. 2 of six gates passed. No composite is shown: the controlled composite is withheld. How the six gates work.
Sources. Tenure and turnover: Texas Alcoholic Beverage Commission licenses and Texas Comptroller sales tax permits, joined to the parcel address. Ownership: Galveston CAD appraisal export, APPRAISAL_INFO.TXT. Residents and workers: 2020 Decennial Census P1_001N and LEHD LODES version 8.
On the boundary itself The host answers on /server/; /arcgis/ returns HTTP 500 on every path. League City's four published candidates run 22, 35, 52 and 242 acres, an eleven-fold spread within one city.
| Gate | Requirement | Disposition | Ledger code |
|---|---|---|---|
| G1 | Official district geometry | Passed | VERIFIED_PASS |
| G2 | Broad establishment universe | Refused on measurement: adopted footprint conflict | REFUSED_ON_MEASUREMENT_ADOPTED_FOOTPRINT_CONFLICT |
| G3 | Valid start history | Refused on measurement: adopted footprint conflict | REFUSED_ON_MEASUREMENT_ADOPTED_FOOTPRINT_CONFLICT |
| G4 | Valid trailing 48-month exit history | Refused on measurement: adopted footprint conflict | REFUSED_ON_MEASUREMENT_ADOPTED_FOOTPRINT_CONFLICT |
| G5 | Standardized ownership | Passed | VERIFIED_PASS |
| G6 | Harmonized context | Refused on measurement: adopted footprint conflict | REFUSED_ON_MEASUREMENT_ADOPTED_FOOTPRINT_CONFLICT |
Read on Old Town Design District, 329 acres, rung 1, adopted downtown zoning district or overlay. Adopted under City design district.
What this record means for a decision
Durability is tested in the Acquisition District Screen; who can act, in the District Capital Plan and the Ground-Floor Strategy.
HALL CAPITAL ADVISORY FINDINGHALL CAPITAL ADVISORY THRESHOLDAn interpretation of the bands below, not a score, a rank or advice.
Median years businesses have traded inside this boundary.
WITHHELD13 dated businesses sit inside this boundary, under the floor of 25. The reading is withheld rather than banded on that few.Openings + closures per 100 starting businesses over four years.
WITHHELD16 ground-floor businesses stood inside this boundary at the start of the window, under the floor of 40. The reading is withheld rather than banded on that few.Ownership concentration: share of commercial accounts held by the largest private owner group.
2.08%NO STANDING144 commercial accounts resolving to 117 owner groups.Structural context · No band or score
Structural presence mix
Baseline Presence is the structural context the three readings are read against. It carries no band and no score. Residents are the 2020 Census count and workers the LODES workplace count, each apportioned to this boundary by block area, with anyone who both lives and works inside the line counted once. It is not a count of observed pedestrian activity. 21 of the 59 census blocks this boundary meets lie wholly inside it.
PUBLIC DATAHALL CAPITAL ADVISORY DERIVED2020 Decennial Census P1_001N and LEHD LODES version 8.
Data status and source confidence
BOUNDARY STANDARDIZEDNOT CLASS A CERTIFIEDPasses all six gates and is not Class A certified. Six passed gates is not certification. No composite is shown: the controlled composite is withheld. How the six gates work.
Sources. Tenure and turnover: Texas Alcoholic Beverage Commission licenses and Texas Comptroller sales tax permits, joined to the parcel address. Ownership: StratMap 2025, TxGIO, Denton 48121. Residents and workers: 2020 Decennial Census P1_001N and LEHD LODES version 8.
On the boundary itself The layer ships the same geometry twice. Summing the two features double-counts Lewisville's downtown exactly twice.
| Gate | Requirement | Disposition | Ledger code |
|---|---|---|---|
| G1 | Official district geometry | Passed | VERIFIED_PASS |
| G2 | Broad establishment universe | Passed | VERIFIED_PASS |
| G3 | Valid start history | Passed | VERIFIED_PASS |
| G4 | Valid trailing 48-month exit history | Passed | VERIFIED_PASS |
| G5 | Standardized ownership | Passed | VERIFIED_PASS |
| G6 | Harmonized context | Passed | VERIFIED_PASS |
Read on Central Business zoning district, 134 acres, rung 1, adopted downtown zoning district or overlay. Adopted under City zoning district.
What this record means for a decision
Durability is tested in the Acquisition District Screen; who can act, in the District Capital Plan and the Ground-Floor Strategy.
HALL CAPITAL ADVISORY FINDINGHALL CAPITAL ADVISORY THRESHOLDAn interpretation of the bands below, not a score, a rank or advice.
Median years businesses have traded inside this boundary.
WITHHELD9 dated businesses sit inside this boundary, under the floor of 25. The reading is withheld rather than banded on that few.Openings + closures per 100 starting businesses over four years.
WITHHELD16 ground-floor businesses stood inside this boundary at the start of the window, under the floor of 40. The reading is withheld rather than banded on that few.Ownership concentration: share of commercial accounts held by the largest private owner group.
11.28%A POSITION133 commercial accounts resolving to 67 owner groups.Structural context · No band or score
Structural presence mix
Baseline Presence is the structural context the three readings are read against. It carries no band and no score. Residents are the 2020 Census count and workers the LODES workplace count, each apportioned to this boundary by block area, with anyone who both lives and works inside the line counted once. It is not a count of observed pedestrian activity. 24 of the 53 census blocks this boundary meets lie wholly inside it.
PUBLIC DATAHALL CAPITAL ADVISORY DERIVED2020 Decennial Census P1_001N and LEHD LODES version 8.
Data status and source confidence
BOUNDARY STANDARDIZEDNOT CLASS A CERTIFIEDNot Class A certified. 3 of six gates passed. No composite is shown: the controlled composite is withheld. How the six gates work.
Sources. Tenure and turnover: Texas Alcoholic Beverage Commission licenses and Texas Comptroller sales tax permits, joined to the parcel address. Ownership: StratMap 2025, TxGIO, Gregg 48183. Residents and workers: 2020 Decennial Census P1_001N and LEHD LODES version 8.
On the boundary itself Longview's five candidates run 108, 133, 356, 466 and 511 acres. The 466-acre Central Business District Boundary is described by the city as being for a downtown inventory project, which is a study boundary rather than a rule.
| Gate | Requirement | Disposition | Ledger code |
|---|---|---|---|
| G1 | Official district geometry | Passed | VERIFIED_PASS |
| G2 | Broad establishment universe | Refused on measurement: placement set materially incomplete | REFUSED_ON_MEASUREMENT_PLACEMENT_SET_MATERIALLY_INCOMPLETE |
| G3 | Valid start history | Refused on measurement: placement set materially incomplete | REFUSED_ON_MEASUREMENT_PLACEMENT_SET_MATERIALLY_INCOMPLETE |
| G4 | Valid trailing 48-month exit history | Refused on measurement: placement set materially incomplete | REFUSED_ON_MEASUREMENT_PLACEMENT_SET_MATERIALLY_INCOMPLETE |
| G5 | Standardized ownership | Passed | VERIFIED_PASS |
| G6 | Harmonized context | Passed | VERIFIED_PASS |
Read on Downtown Community Plan Implementation Overlay, 4,255 acres, rung 1, adopted downtown zoning district or overlay. Adopted under LAMC Chapter 1A, Council File 22-0617 (DTLA 2040).
What this record means for a decision
Durability is tested in the Acquisition District Screen; who can act, in the District Capital Plan and the Ground-Floor Strategy.
HALL CAPITAL ADVISORY FINDINGHALL CAPITAL ADVISORY THRESHOLDAn interpretation of the bands below, not a score, a rank or advice.
Median years businesses have traded inside this boundary.
12.68 yearsSETTLINGprovisionalThe median across 33,529 businesses trading inside the line.Openings + closures per 100 starting businesses over four years.
27.2 per 100HELDprovisional5,005 opened and 3,798 closed against 32,323 ground-floor businesses at the start of the window.Ownership concentration: share of commercial accounts held by the largest private owner group.
WITHHELDNo owner name is published inside this boundary.Structural context · No band or score
Structural presence mix
Baseline Presence is the structural context the three readings are read against. It carries no band and no score. Residents are the 2020 Census count and workers the LODES workplace count, each apportioned to this boundary by block area, with anyone who both lives and works inside the line counted once. It is not a count of observed pedestrian activity. 409 of the 562 census blocks this boundary meets lie wholly inside it.
PUBLIC DATAHALL CAPITAL ADVISORY DERIVED2020 Decennial Census P1_001N and LEHD LODES version 8.
Data status and source confidence
BOUNDARY STANDARDIZEDNOT CLASS A CERTIFIEDNot Class A certified. 1 of six gates passed. No composite is shown: the controlled composite is withheld. How the six gates work.
Sources. Tenure and turnover: Los Angeles Listing of All Businesses (r4uk-afju). Ownership: NOT AVAILABLE. Residents and workers: 2020 Decennial Census P1_001N and LEHD LODES version 8.
| Gate | Requirement | Disposition | Ledger code |
|---|---|---|---|
| G1 | Official district geometry | Passed | VERIFIED_PASS |
| G2 | Broad establishment universe | Refused on measurement: superseded published footprint | REFUSED_ON_MEASUREMENT_SUPERSEDED_PUBLISHED_FOOTPRINT |
| G3 | Valid start history | Refused on measurement: superseded published footprint | REFUSED_ON_MEASUREMENT_SUPERSEDED_PUBLISHED_FOOTPRINT |
| G4 | Valid trailing 48-month exit history | Refused on measurement: superseded published footprint | REFUSED_ON_MEASUREMENT_SUPERSEDED_PUBLISHED_FOOTPRINT |
| G5 | Standardized ownership | Source unavailable | BLOCKED_SOURCE_UNAVAILABLE |
| G6 | Harmonized context | Refused on measurement: superseded published footprint | REFUSED_ON_MEASUREMENT_SUPERSEDED_PUBLISHED_FOOTPRINT |
Read on Downtown Development Review Overlay, 535 acres, rung 1, adopted downtown zoning district or overlay. Adopted under Louisville Metro Code of Ordinances ch. 162 sec. 162.02, Lou. Ord. No. 233-1992 approved 12-28-1992, as amended by Lou. Metro Ord. No. 265-2007 and Lou. Metro Ord. No. 162-2013.
What this record means for a decision
Durability is tested in the Acquisition District Screen; who can act, in the District Capital Plan and the Ground-Floor Strategy.
HALL CAPITAL ADVISORY FINDINGHALL CAPITAL ADVISORY THRESHOLDAn interpretation of the bands below, not a score, a rank or advice.
Median years businesses have traded inside this boundary.
WITHHELDNo dated business register covers this district.Openings + closures per 100 starting businesses over four years.
WITHHELDNo register carrying a closing date covers this district.Ownership concentration: share of commercial accounts held by the largest private owner group.
WITHHELDNo owner name is published inside this boundary.Structural context · No band or score
Structural presence mix
Baseline Presence is the structural context the three readings are read against. It carries no band and no score. Residents are the 2020 Census count and workers the LODES workplace count, each apportioned to this boundary by block area, with anyone who both lives and works inside the line counted once. It is not a count of observed pedestrian activity. 79 of the 144 census blocks this boundary meets lie wholly inside it.
PUBLIC DATAHALL CAPITAL ADVISORY DERIVED2020 Decennial Census P1_001N and LEHD LODES version 8.
Data status and source confidence
BOUNDARY STANDARDIZEDNOT CLASS A CERTIFIEDNot Class A certified. 2 of six gates passed. No composite is shown: the controlled composite is withheld. How the six gates work.
Sources. Tenure and turnover: NOT AVAILABLE. Ownership: NOT AVAILABLE. Residents and workers: 2020 Decennial Census P1_001N and LEHD LODES version 8.
| Gate | Requirement | Disposition | Ledger code |
|---|---|---|---|
| G1 | Official district geometry | Passed | VERIFIED_PASS |
| G2 | Broad establishment universe | Source unavailable | BLOCKED_SOURCE_UNAVAILABLE |
| G3 | Valid start history | Source unavailable | BLOCKED_SOURCE_UNAVAILABLE |
| G4 | Valid trailing 48-month exit history | Source unavailable | BLOCKED_SOURCE_UNAVAILABLE |
| G5 | Standardized ownership | Source unavailable | BLOCKED_SOURCE_UNAVAILABLE |
| G6 | Harmonized context | Passed | VERIFIED_PASS |
Read on Central Business District TIF, 765 acres, rung 3, downtown-purposed special district. Adopted under Reinvestment zone established December 2001, terminates 31 December 2040.
What this record means for a decision
Durability is tested in the Acquisition District Screen; who can act, in the District Capital Plan and the Ground-Floor Strategy.
HALL CAPITAL ADVISORY FINDINGHALL CAPITAL ADVISORY THRESHOLDAn interpretation of the bands below, not a score, a rank or advice.
Median years businesses have traded inside this boundary.
WITHHELD13 dated businesses sit inside this boundary, under the floor of 25. The reading is withheld rather than banded on that few.Openings + closures per 100 starting businesses over four years.
WITHHELD19 ground-floor businesses stood inside this boundary at the start of the window, under the floor of 40. The reading is withheld rather than banded on that few.Ownership concentration: share of commercial accounts held by the largest private owner group.
7.72%NO STANDINGprovisional557 commercial accounts resolving to 282 owner groups.Structural context · No band or score
Structural presence mix
Baseline Presence is the structural context the three readings are read against. It carries no band and no score. Residents are the 2020 Census count and workers the LODES workplace count, each apportioned to this boundary by block area, with anyone who both lives and works inside the line counted once. It is not a count of observed pedestrian activity. 116 of the 206 census blocks this boundary meets lie wholly inside it.
PUBLIC DATAHALL CAPITAL ADVISORY DERIVED2020 Decennial Census P1_001N and LEHD LODES version 8.
Data status and source confidence
BOUNDARY STANDARDIZEDNOT CLASS A CERTIFIEDNot Class A certified. 0 of six gates passed. No composite is shown: the controlled composite is withheld. How the six gates work.
Sources. Tenure and turnover: Texas Alcoholic Beverage Commission licenses and Texas Comptroller sales tax permits, joined to the parcel address. Ownership: City of Lubbock parcel service for owner and class, StratMap 48303 for situs. Residents and workers: 2020 Decennial Census P1_001N and LEHD LODES version 8.
On the boundary itself A where clause of 1=1 returns a second, unrelated improvement district eight miles west and inflates the answer.
| Gate | Requirement | Disposition | Ledger code |
|---|---|---|---|
| G1 | Official district geometry | Source unavailable | BLOCKED_SOURCE_UNAVAILABLE |
| G2 | Broad establishment universe | Source unavailable | BLOCKED_SOURCE_UNAVAILABLE |
| G3 | Valid start history | Source unavailable | BLOCKED_SOURCE_UNAVAILABLE |
| G4 | Valid trailing 48-month exit history | Source unavailable | BLOCKED_SOURCE_UNAVAILABLE |
| G5 | Standardized ownership | Source unavailable | BLOCKED_SOURCE_UNAVAILABLE |
| G6 | Harmonized context | Source unavailable | BLOCKED_SOURCE_UNAVAILABLE |
Read on CC-DT City Core Downtown zoning, 153 acres, rung 1, adopted downtown zoning district or overlay. Adopted under City development code.
What this record means for a decision
Durability is tested in the Acquisition District Screen; who can act, in the District Capital Plan and the Ground-Floor Strategy.
HALL CAPITAL ADVISORY FINDINGHALL CAPITAL ADVISORY THRESHOLDAn interpretation of the bands below, not a score, a rank or advice.
Median years businesses have traded inside this boundary.
2.36 yearsTHINprovisionalThe median across 30 businesses trading inside the line.Openings + closures per 100 starting businesses over four years.
93.6 per 100CHURNINGprovisional27 opened and 17 closed against 47 ground-floor businesses at the start of the window.Ownership concentration: share of commercial accounts held by the largest private owner group.
2.37%NO STANDING464 commercial accounts resolving to 284 owner groups.Structural context · No band or score
Structural presence mix
Baseline Presence is the structural context the three readings are read against. It carries no band and no score. Residents are the 2020 Census count and workers the LODES workplace count, each apportioned to this boundary by block area, with anyone who both lives and works inside the line counted once. It is not a count of observed pedestrian activity. 44 of the 74 census blocks this boundary meets lie wholly inside it.
PUBLIC DATAHALL CAPITAL ADVISORY DERIVED2020 Decennial Census P1_001N and LEHD LODES version 8.
Data status and source confidence
BOUNDARY STANDARDIZEDNOT CLASS A CERTIFIEDNot Class A certified. 2 of six gates passed. No composite is shown: the controlled composite is withheld. How the six gates work.
Sources. Tenure and turnover: Texas Alcoholic Beverage Commission licenses and Texas Comptroller sales tax permits, joined to the parcel address. Ownership: Hidalgo CAD parcel and appraisal export, HCADShapefiles. Residents and workers: 2020 Decennial Census P1_001N and LEHD LODES version 8.
On the boundary itself The host path is /publication/, not /arcgis/. The city's ArcGIS Online organization carries nothing about downtown.
| Gate | Requirement | Disposition | Ledger code |
|---|---|---|---|
| G1 | Official district geometry | Passed | VERIFIED_PASS |
| G2 | Broad establishment universe | Refused on measurement: adopted footprint conflict | REFUSED_ON_MEASUREMENT_ADOPTED_FOOTPRINT_CONFLICT |
| G3 | Valid start history | Refused on measurement: adopted footprint conflict | REFUSED_ON_MEASUREMENT_ADOPTED_FOOTPRINT_CONFLICT |
| G4 | Valid trailing 48-month exit history | Refused on measurement: adopted footprint conflict | REFUSED_ON_MEASUREMENT_ADOPTED_FOOTPRINT_CONFLICT |
| G5 | Standardized ownership | Passed | VERIFIED_PASS |
| G6 | Harmonized context | Refused on measurement: adopted footprint conflict | REFUSED_ON_MEASUREMENT_ADOPTED_FOOTPRINT_CONFLICT |
Read on MTC McKinney Town Center zoning, 268 acres, rung 1, adopted downtown zoning district or overlay. Adopted under City zoning district.
What this record means for a decision
Durability is tested in the Acquisition District Screen; who can act, in the District Capital Plan and the Ground-Floor Strategy.
HALL CAPITAL ADVISORY FINDINGHALL CAPITAL ADVISORY THRESHOLDAn interpretation of the bands below, not a score, a rank or advice.
Median years businesses have traded inside this boundary.
5.29 yearsTHINThe median across 58 businesses trading inside the line.Openings + closures per 100 starting businesses over four years.
61.3 per 100CYCLING29 opened and 17 closed against 75 ground-floor businesses at the start of the window.Ownership concentration: share of commercial accounts held by the largest private owner group.
3.62%NO STANDING304 commercial accounts resolving to 165 owner groups.Structural context · No band or score
Structural presence mix
Baseline Presence is the structural context the three readings are read against. It carries no band and no score. Residents are the 2020 Census count and workers the LODES workplace count, each apportioned to this boundary by block area, with anyone who both lives and works inside the line counted once. It is not a count of observed pedestrian activity. 66 of the 115 census blocks this boundary meets lie wholly inside it.
PUBLIC DATAHALL CAPITAL ADVISORY DERIVED2020 Decennial Census P1_001N and LEHD LODES version 8.
Data status and source confidence
BOUNDARY STANDARDIZEDNOT CLASS A CERTIFIEDPasses all six gates and is not Class A certified. Six passed gates is not certification. No composite is shown: the controlled composite is withheld. How the six gates work.
Sources. Tenure and turnover: Texas Alcoholic Beverage Commission licenses and Texas Comptroller sales tax permits, joined to the parcel address. Ownership: Collin CAD property roll, data.texas.gov 5tkr-3759. Residents and workers: 2020 Decennial Census P1_001N and LEHD LODES version 8.
On the boundary itself McKinney's TIRZ 1 is 981 acres, 3.7 times the zoning district.
| Gate | Requirement | Disposition | Ledger code |
|---|---|---|---|
| G1 | Official district geometry | Passed | VERIFIED_PASS |
| G2 | Broad establishment universe | Passed | VERIFIED_PASS |
| G3 | Valid start history | Passed | VERIFIED_PASS |
| G4 | Valid trailing 48-month exit history | Passed | VERIFIED_PASS |
| G5 | Standardized ownership | Passed | VERIFIED_PASS |
| G6 | Harmonized context | Passed | VERIFIED_PASS |
Read on Central Business Improvement District, 3,928 acres, rung 3, downtown-purposed special district. Adopted under Tenn. Code Ann. sec. 7-84-101 et seq.; administered by the Downtown Memphis Commission.
What this record means for a decision
Durability is tested in the Acquisition District Screen; who can act, in the District Capital Plan and the Ground-Floor Strategy.
HALL CAPITAL ADVISORY FINDINGHALL CAPITAL ADVISORY THRESHOLDAn interpretation of the bands below, not a score, a rank or advice.
Median years businesses have traded inside this boundary.
WITHHELDNo dated business register covers this district.Openings + closures per 100 starting businesses over four years.
WITHHELDNo register carrying a closing date covers this district.Ownership concentration: share of commercial accounts held by the largest private owner group.
2.18%NO STANDING1,053 commercial accounts resolving to 596 owner groups.Structural context · No band or score
Structural presence mix
Baseline Presence is the structural context the three readings are read against. It carries no band and no score. Residents are the 2020 Census count and workers the LODES workplace count, each apportioned to this boundary by block area, with anyone who both lives and works inside the line counted once. It is not a count of observed pedestrian activity. 648 of the 786 census blocks this boundary meets lie wholly inside it.
PUBLIC DATAHALL CAPITAL ADVISORY DERIVED2020 Decennial Census P1_001N and LEHD LODES version 8.
Data status and source confidence
BOUNDARY STANDARDIZEDNOT CLASS A CERTIFIEDNot Class A certified. 3 of six gates passed. No composite is shown: the controlled composite is withheld. How the six gates work.
Sources. Tenure and turnover: NOT AVAILABLE. Ownership: Shelby County certified tax roll (CERT_TAX_PARCELS, 2025), republished by the City of Memphis. Residents and workers: 2020 Decennial Census P1_001N and LEHD LODES version 8.
| Gate | Requirement | Disposition | Ledger code |
|---|---|---|---|
| G1 | Official district geometry | Passed | VERIFIED_PASS |
| G2 | Broad establishment universe | Source unavailable | BLOCKED_SOURCE_UNAVAILABLE |
| G3 | Valid start history | Source unavailable | BLOCKED_SOURCE_UNAVAILABLE |
| G4 | Valid trailing 48-month exit history | Source unavailable | BLOCKED_SOURCE_UNAVAILABLE |
| G5 | Standardized ownership | Passed | VERIFIED_PASS |
| G6 | Harmonized context | Passed | VERIFIED_PASS |
Read on Downtown Mesa zoning districts, 519 acres, rung 1, adopted downtown zoning district or overlay. Adopted under Mesa Zoning Ordinance, Downtown Business, Core and Residential districts.
What this record means for a decision
Durability is tested in the Acquisition District Screen; who can act, in the District Capital Plan and the Ground-Floor Strategy.
HALL CAPITAL ADVISORY FINDINGHALL CAPITAL ADVISORY THRESHOLDAn interpretation of the bands below, not a score, a rank or advice.
Median years businesses have traded inside this boundary.
WITHHELDNo dated business register covers this district.Openings + closures per 100 starting businesses over four years.
WITHHELDNo register carrying a closing date covers this district.Ownership concentration: share of commercial accounts held by the largest private owner group.
2.46%NO STANDING568 commercial accounts resolving to 295 owner groups.Structural context · No band or score
Structural presence mix
Baseline Presence is the structural context the three readings are read against. It carries no band and no score. Residents are the 2020 Census count and workers the LODES workplace count, each apportioned to this boundary by block area, with anyone who both lives and works inside the line counted once. It is not a count of observed pedestrian activity. 1 of the 132 census blocks this boundary meets lie wholly inside it.
PUBLIC DATAHALL CAPITAL ADVISORY DERIVED2020 Decennial Census P1_001N and LEHD LODES version 8.
Data status and source confidence
BOUNDARY STANDARDIZEDNOT CLASS A CERTIFIEDNot Class A certified. 2 of six gates passed. No composite is shown: the controlled composite is withheld. How the six gates work.
Sources. Tenure and turnover: NOT AVAILABLE. Ownership: Maricopa County Assessor parcels. Residents and workers: 2020 Decennial Census P1_001N and LEHD LODES version 8.
| Gate | Requirement | Disposition | Ledger code |
|---|---|---|---|
| G1 | Official district geometry | Passed | VERIFIED_PASS |
| G2 | Broad establishment universe | Refused on measurement: adopted footprint conflict | REFUSED_ON_MEASUREMENT_ADOPTED_FOOTPRINT_CONFLICT |
| G3 | Valid start history | Refused on measurement: adopted footprint conflict | REFUSED_ON_MEASUREMENT_ADOPTED_FOOTPRINT_CONFLICT |
| G4 | Valid trailing 48-month exit history | Refused on measurement: adopted footprint conflict | REFUSED_ON_MEASUREMENT_ADOPTED_FOOTPRINT_CONFLICT |
| G5 | Standardized ownership | Passed | VERIFIED_PASS |
| G6 | Harmonized context | Refused on measurement: adopted footprint conflict | REFUSED_ON_MEASUREMENT_ADOPTED_FOOTPRINT_CONFLICT |
Read on Downtown Main Street Program Area, 47 acres, rung 4, Main Street or historic district. Adopted under Texas Main Street program area.
What this record means for a decision
Durability is tested in the Acquisition District Screen; who can act, in the District Capital Plan and the Ground-Floor Strategy.
HALL CAPITAL ADVISORY FINDINGHALL CAPITAL ADVISORY THRESHOLDAn interpretation of the bands below, not a score, a rank or advice.
Median years businesses have traded inside this boundary.
WITHHELD2 dated businesses sit inside this boundary, under the floor of 25. The reading is withheld rather than banded on that few.Openings + closures per 100 starting businesses over four years.
WITHHELD3 ground-floor businesses stood inside this boundary at the start of the window, under the floor of 40. The reading is withheld rather than banded on that few.Ownership concentration: share of commercial accounts held by the largest private owner group.
4.40%NO STANDING91 commercial accounts resolving to 60 owner groups.Structural context · No band or score
Structural presence mix
Baseline Presence is the structural context the three readings are read against. It carries no band and no score. Residents are the 2020 Census count and workers the LODES workplace count, each apportioned to this boundary by block area, with anyone who both lives and works inside the line counted once. It is not a count of observed pedestrian activity. 15 of the 39 census blocks this boundary meets lie wholly inside it.
PUBLIC DATAHALL CAPITAL ADVISORY DERIVED2020 Decennial Census P1_001N and LEHD LODES version 8.
Data status and source confidence
BOUNDARY STANDARDIZEDNOT CLASS A CERTIFIEDNot Class A certified. 5 of six gates passed. No composite is shown: the controlled composite is withheld. How the six gates work.
Sources. Tenure and turnover: Texas Alcoholic Beverage Commission licenses and Texas Comptroller sales tax permits, joined to the parcel address. Ownership: Dallas CAD certified roll, ACCOUNT_INFO.CSV. Residents and workers: 2020 Decennial Census P1_001N and LEHD LODES version 8.
On the boundary itself Layer 1 of the same service is a separate facade improvement area of similar size. They are different boundaries.
| Gate | Requirement | Disposition | Ledger code |
|---|---|---|---|
| G1 | Official district geometry | Passed | VERIFIED_PASS |
| G2 | Broad establishment universe | Passed | VERIFIED_PASS |
| G3 | Valid start history | Passed | VERIFIED_PASS |
| G4 | Valid trailing 48-month exit history | Failed its threshold | FAILED_THRESHOLD |
| G5 | Standardized ownership | Passed | VERIFIED_PASS |
| G6 | Harmonized context | Passed | VERIFIED_PASS |
Read on Miami Downtown Development Authority, 1,187 acres, rung 3, downtown-purposed special district. Adopted under City of Miami Code Chapter 14.
What this record means for a decision
Durability is tested in the Acquisition District Screen; who can act, in the District Capital Plan and the Ground-Floor Strategy.
HALL CAPITAL ADVISORY FINDINGHALL CAPITAL ADVISORY THRESHOLDAn interpretation of the bands below, not a score, a rank or advice.
Median years businesses have traded inside this boundary.
7.56 yearsSETTLINGprovisionalThe median across 10,829 businesses trading inside the line.Openings + closures per 100 starting businesses over four years.
50.6 per 100CYCLINGprovisional3,368 opened and 821 closed against 8,282 ground-floor businesses at the start of the window.Ownership concentration: share of commercial accounts held by the largest private owner group.
4.86%NO STANDING3,313 commercial accounts resolving to 1,020 owner groups.Structural context · No band or score
Structural presence mix
Baseline Presence is the structural context the three readings are read against. It carries no band and no score. Residents are the 2020 Census count and workers the LODES workplace count, each apportioned to this boundary by block area, with anyone who both lives and works inside the line counted once. It is not a count of observed pedestrian activity. 265 of the 364 census blocks this boundary meets lie wholly inside it.
PUBLIC DATAHALL CAPITAL ADVISORY DERIVED2020 Decennial Census P1_001N and LEHD LODES version 8.
Data status and source confidence
BOUNDARY STANDARDIZEDNOT CLASS A CERTIFIEDNot Class A certified. 4 of six gates passed. No composite is shown: the controlled composite is withheld. How the six gates work.
Sources. Tenure and turnover: Miami-Dade County Local Business Tax roll. Ownership: Miami-Dade Property Appraiser account view (PaGISView_gdb). Residents and workers: 2020 Decennial Census P1_001N and LEHD LODES version 8.
| Gate | Requirement | Disposition | Ledger code |
|---|---|---|---|
| G1 | Official district geometry | Passed | VERIFIED_PASS |
| G2 | Broad establishment universe | Passed | VERIFIED_PASS |
| G3 | Valid start history | Refused on measurement: source history truncated | REFUSED_ON_MEASUREMENT_SOURCE_HISTORY_TRUNCATED |
| G4 | Valid trailing 48-month exit history | Refused on measurement: contaminated published reading | REFUSED_ON_MEASUREMENT_CONTAMINATED_PUBLISHED_READING |
| G5 | Standardized ownership | Passed | VERIFIED_PASS |
| G6 | Harmonized context | Passed | VERIFIED_PASS |
Read on Downtown Midland Management District, 201 acres, rung 3, downtown-purposed special district. Adopted under Special District Local Laws Code chapter 3821, House Bill 3592 of 2003.
What this record means for a decision
Durability is tested in the Acquisition District Screen; who can act, in the District Capital Plan and the Ground-Floor Strategy.
HALL CAPITAL ADVISORY FINDINGHALL CAPITAL ADVISORY THRESHOLDAn interpretation of the bands below, not a score, a rank or advice.
Median years businesses have traded inside this boundary.
5.65 yearsTHINThe median across 33 businesses trading inside the line.Openings + closures per 100 starting businesses over four years.
73.5 per 100REPLACING21 opened and 15 closed against 49 ground-floor businesses at the start of the window.Ownership concentration: share of commercial accounts held by the largest private owner group.
7.09%NO STANDINGprovisional282 commercial accounts resolving to 122 owner groups.Structural context · No band or score
Structural presence mix
Baseline Presence is the structural context the three readings are read against. It carries no band and no score. Residents are the 2020 Census count and workers the LODES workplace count, each apportioned to this boundary by block area, with anyone who both lives and works inside the line counted once. It is not a count of observed pedestrian activity. 41 of the 79 census blocks this boundary meets lie wholly inside it.
PUBLIC DATAHALL CAPITAL ADVISORY DERIVED2020 Decennial Census P1_001N and LEHD LODES version 8.
Data status and source confidence
BOUNDARY STANDARDIZEDNOT CLASS A CERTIFIEDNot Class A certified. 5 of six gates passed. No composite is shown: the controlled composite is withheld. How the six gates work.
Sources. Tenure and turnover: Texas Alcoholic Beverage Commission licenses and Texas Comptroller sales tax permits, joined to the parcel address. Ownership: Midland CAD certified collectors export; StratMap 48329 geometry for the boundary. Residents and workers: 2020 Decennial Census P1_001N and LEHD LODES version 8.
On the boundary itself Midland's downtown TIRZ 2 is 460 acres, 2.3 times the management district.
| Gate | Requirement | Disposition | Ledger code |
|---|---|---|---|
| G1 | Official district geometry | Passed | VERIFIED_PASS |
| G2 | Broad establishment universe | Passed | VERIFIED_PASS |
| G3 | Valid start history | Passed | VERIFIED_PASS |
| G4 | Valid trailing 48-month exit history | Passed | VERIFIED_PASS |
| G5 | Standardized ownership | Refused on measurement: parcel layer coverage incomplete | REFUSED_ON_MEASUREMENT_PARCEL_LAYER_COVERAGE_INCOMPLETE |
| G6 | Harmonized context | Passed | VERIFIED_PASS |
Read on Downtown districts C9A to C9H, 672 acres, rung 1, adopted downtown zoning district or overlay. Adopted under Milwaukee Code Ch. 295 Subchapter 7.
What this record means for a decision
Durability is tested in the Acquisition District Screen; who can act, in the District Capital Plan and the Ground-Floor Strategy.
HALL CAPITAL ADVISORY FINDINGHALL CAPITAL ADVISORY THRESHOLDAn interpretation of the bands below, not a score, a rank or advice.
Median years businesses have traded inside this boundary.
WITHHELDNo dated business register covers this district.Openings + closures per 100 starting businesses over four years.
WITHHELDNo register carrying a closing date covers this district.Ownership concentration: share of commercial accounts held by the largest private owner group.
2.78%NO STANDING827 commercial accounts resolving to 430 owner groups.Structural context · No band or score
Structural presence mix
Baseline Presence is the structural context the three readings are read against. It carries no band and no score. Residents are the 2020 Census count and workers the LODES workplace count, each apportioned to this boundary by block area, with anyone who both lives and works inside the line counted once. It is not a count of observed pedestrian activity. 60 of the 255 census blocks this boundary meets lie wholly inside it.
PUBLIC DATAHALL CAPITAL ADVISORY DERIVED2020 Decennial Census P1_001N and LEHD LODES version 8.
Data status and source confidence
BOUNDARY STANDARDIZEDNOT CLASS A CERTIFIEDNot Class A certified. 2 of six gates passed. No composite is shown: the controlled composite is withheld. How the six gates work.
Sources. Tenure and turnover: NOT AVAILABLE. Ownership: City of Milwaukee MPROP master property file, served joined to the parcel geometry as layer 2 of the city parcel service. Residents and workers: 2020 Decennial Census P1_001N and LEHD LODES version 8.
| Gate | Requirement | Disposition | Ledger code |
|---|---|---|---|
| G1 | Official district geometry | Passed | VERIFIED_PASS |
| G2 | Broad establishment universe | Refused on measurement: adopted footprint conflict | REFUSED_ON_MEASUREMENT_ADOPTED_FOOTPRINT_CONFLICT |
| G3 | Valid start history | Refused on measurement: adopted footprint conflict | REFUSED_ON_MEASUREMENT_ADOPTED_FOOTPRINT_CONFLICT |
| G4 | Valid trailing 48-month exit history | Refused on measurement: adopted footprint conflict | REFUSED_ON_MEASUREMENT_ADOPTED_FOOTPRINT_CONFLICT |
| G5 | Standardized ownership | Passed | VERIFIED_PASS |
| G6 | Harmonized context | Refused on measurement: adopted footprint conflict | REFUSED_ON_MEASUREMENT_ADOPTED_FOOTPRINT_CONFLICT |
Read on Downtown Center and Downtown Destination districts, 1,304 acres, rung 1, adopted downtown zoning district or overlay. Adopted under Minneapolis Code of Ordinances Title 20, Zoning Code, Sec. 521.10 primary zoning districts; DT1 Downtown Center District and DT2 Downtown Destination District.
What this record means for a decision
Durability is tested in the Acquisition District Screen; who can act, in the District Capital Plan and the Ground-Floor Strategy.
HALL CAPITAL ADVISORY FINDINGHALL CAPITAL ADVISORY THRESHOLDAn interpretation of the bands below, not a score, a rank or advice.
Median years businesses have traded inside this boundary.
WITHHELDNo dated business register covers this district.Openings + closures per 100 starting businesses over four years.
WITHHELDNo register carrying a closing date covers this district.Ownership concentration: share of commercial accounts held by the largest private owner group.
7.21%NO STANDING1,165 commercial accounts resolving to 433 owner groups.Structural context · No band or score
Structural presence mix
Baseline Presence is the structural context the three readings are read against. It carries no band and no score. Residents are the 2020 Census count and workers the LODES workplace count, each apportioned to this boundary by block area, with anyone who both lives and works inside the line counted once. It is not a count of observed pedestrian activity. 202 of the 330 census blocks this boundary meets lie wholly inside it.
PUBLIC DATAHALL CAPITAL ADVISORY DERIVED2020 Decennial Census P1_001N and LEHD LODES version 8.
Data status and source confidence
BOUNDARY STANDARDIZEDNOT CLASS A CERTIFIEDNot Class A certified. 3 of six gates passed. No composite is shown: the controlled composite is withheld. How the six gates work.
Sources. Tenure and turnover: NOT AVAILABLE. Ownership: Hennepin County property, City of Minneapolis (MUNIC_CD 01). Residents and workers: 2020 Decennial Census P1_001N and LEHD LODES version 8.
| Gate | Requirement | Disposition | Ledger code |
|---|---|---|---|
| G1 | Official district geometry | Passed | VERIFIED_PASS |
| G2 | Broad establishment universe | Source unavailable | BLOCKED_SOURCE_UNAVAILABLE |
| G3 | Valid start history | Source unavailable | BLOCKED_SOURCE_UNAVAILABLE |
| G4 | Valid trailing 48-month exit history | Source unavailable | BLOCKED_SOURCE_UNAVAILABLE |
| G5 | Standardized ownership | Passed | VERIFIED_PASS |
| G6 | Harmonized context | Passed | VERIFIED_PASS |
Read on Downtown Code district, 1,398 acres, rung 1, adopted downtown zoning district or overlay. Adopted under Metro Nashville-Davidson County Zoning Code Chapter 17.37.
What this record means for a decision
Durability is tested in the Acquisition District Screen; who can act, in the District Capital Plan and the Ground-Floor Strategy.
HALL CAPITAL ADVISORY FINDINGHALL CAPITAL ADVISORY THRESHOLDAn interpretation of the bands below, not a score, a rank or advice.
Median years businesses have traded inside this boundary.
WITHHELDNo dated business register covers this district.Openings + closures per 100 starting businesses over four years.
WITHHELDNo register carrying a closing date covers this district.Ownership concentration: share of commercial accounts held by the largest private owner group.
2.64%NO STANDING909 commercial accounts resolving to 466 owner groups.Structural context · No band or score
Structural presence mix
Baseline Presence is the structural context the three readings are read against. It carries no band and no score. Residents are the 2020 Census count and workers the LODES workplace count, each apportioned to this boundary by block area, with anyone who both lives and works inside the line counted once. It is not a count of observed pedestrian activity. 268 of the 398 census blocks this boundary meets lie wholly inside it.
PUBLIC DATAHALL CAPITAL ADVISORY DERIVED2020 Decennial Census P1_001N and LEHD LODES version 8.
Data status and source confidence
BOUNDARY STANDARDIZEDNOT CLASS A CERTIFIEDNot Class A certified. 3 of six gates passed. No composite is shown: the controlled composite is withheld. How the six gates work.
Sources. Tenure and turnover: NOT AVAILABLE. Ownership: Metro Nashville and Davidson County parcels (Parcels_view). Residents and workers: 2020 Decennial Census P1_001N and LEHD LODES version 8.
| Gate | Requirement | Disposition | Ledger code |
|---|---|---|---|
| G1 | Official district geometry | Passed | VERIFIED_PASS |
| G2 | Broad establishment universe | Source unavailable | BLOCKED_SOURCE_UNAVAILABLE |
| G3 | Valid start history | Source unavailable | BLOCKED_SOURCE_UNAVAILABLE |
| G4 | Valid trailing 48-month exit history | Source unavailable | BLOCKED_SOURCE_UNAVAILABLE |
| G5 | Standardized ownership | Passed | VERIFIED_PASS |
| G6 | Harmonized context | Passed | VERIFIED_PASS |
Read on Main Street District, 303 acres, rung 4, Main Street or historic district. Adopted under Texas Main Street program district.
What this record means for a decision
Durability is tested in the Acquisition District Screen; who can act, in the District Capital Plan and the Ground-Floor Strategy.
HALL CAPITAL ADVISORY FINDINGHALL CAPITAL ADVISORY THRESHOLDAn interpretation of the bands below, not a score, a rank or advice.
Median years businesses have traded inside this boundary.
WITHHELD14 dated businesses sit inside this boundary, under the floor of 25. The reading is withheld rather than banded on that few.Openings + closures per 100 starting businesses over four years.
WITHHELD23 ground-floor businesses stood inside this boundary at the start of the window, under the floor of 40. The reading is withheld rather than banded on that few.Ownership concentration: share of commercial accounts held by the largest private owner group.
3.65%NO STANDINGprovisional219 commercial accounts resolving to 147 owner groups.Structural context · No band or score
Structural presence mix
Baseline Presence is the structural context the three readings are read against. It carries no band and no score. Residents are the 2020 Census count and workers the LODES workplace count, each apportioned to this boundary by block area, with anyone who both lives and works inside the line counted once. It is not a count of observed pedestrian activity. 43 of the 94 census blocks this boundary meets lie wholly inside it.
PUBLIC DATAHALL CAPITAL ADVISORY DERIVED2020 Decennial Census P1_001N and LEHD LODES version 8.
Data status and source confidence
BOUNDARY STANDARDIZEDNOT CLASS A CERTIFIEDNot Class A certified. 5 of six gates passed. No composite is shown: the controlled composite is withheld. How the six gates work.
Sources. Tenure and turnover: Texas Alcoholic Beverage Commission licenses and Texas Comptroller sales tax permits, joined to the parcel address. Ownership: Comal AD parcel service for owner, mailing and situs; Comal AD 2021 Certified Appraisal Roll for the state category code. Residents and workers: 2020 Decennial Census P1_001N and LEHD LODES version 8.
On the boundary itself New Braunfels zoning carries commercial classes C-1 through C-4 but no downtown district, so the highest rung available is the Main Street boundary.
| Gate | Requirement | Disposition | Ledger code |
|---|---|---|---|
| G1 | Official district geometry | Passed | VERIFIED_PASS |
| G2 | Broad establishment universe | Passed | VERIFIED_PASS |
| G3 | Valid start history | Passed | VERIFIED_PASS |
| G4 | Valid trailing 48-month exit history | Passed | VERIFIED_PASS |
| G5 | Standardized ownership | Source unavailable | BLOCKED_SOURCE_UNAVAILABLE |
| G6 | Harmonized context | Passed | VERIFIED_PASS |
Read on Special Lower Manhattan District, 434 acres, rung 1, adopted downtown zoning district or overlay. Adopted under NYC Zoning Resolution Article IX Chapter 1.
What this record means for a decision
Durability is tested in the Acquisition District Screen; who can act, in the District Capital Plan and the Ground-Floor Strategy.
HALL CAPITAL ADVISORY FINDINGHALL CAPITAL ADVISORY THRESHOLDAn interpretation of the bands below, not a score, a rank or advice.
Median years businesses have traded inside this boundary.
6.54 yearsSETTLINGThe median across 251 businesses trading inside the line.Openings + closures per 100 starting businesses over four years.
66.8 per 100CYCLING133 opened and 113 closed against 368 ground-floor businesses at the start of the window.Ownership concentration: share of commercial accounts held by the largest private owner group.
0.88%NO STANDING453 commercial accounts resolving to 385 owner groups.Structural context · No band or score
Structural presence mix
Baseline Presence is the structural context the three readings are read against. It carries no band and no score. Residents are the 2020 Census count and workers the LODES workplace count, each apportioned to this boundary by block area, with anyone who both lives and works inside the line counted once. It is not a count of observed pedestrian activity. 168 of the 212 census blocks this boundary meets lie wholly inside it.
PUBLIC DATAHALL CAPITAL ADVISORY DERIVED2020 Decennial Census P1_001N and LEHD LODES version 8.
Data status and source confidence
BOUNDARY STANDARDIZEDNOT CLASS A CERTIFIEDPasses all six gates and is not Class A certified. Six passed gates is not certification. No composite is shown: the controlled composite is withheld. How the six gates work.
Sources. Tenure and turnover: NYC DCWP Legally Operating Businesses (w7w3-xahh). Ownership: NYC PLUTO (64uk-42ks). Residents and workers: 2020 Decennial Census P1_001N and LEHD LODES version 8.
| Gate | Requirement | Disposition | Ledger code |
|---|---|---|---|
| G1 | Official district geometry | Passed | VERIFIED_PASS |
| G2 | Broad establishment universe | Passed | VERIFIED_PASS |
| G3 | Valid start history | Passed | VERIFIED_PASS |
| G4 | Valid trailing 48-month exit history | Passed | VERIFIED_PASS |
| G5 | Standardized ownership | Passed | VERIFIED_PASS |
| G6 | Harmonized context | Passed | VERIFIED_PASS |
Read on Downtown Overlay Zone, 122 acres, rung 1, adopted downtown zoning district or overlay. Adopted under Article 14-20, Ordinance 2019-08, adopted 26 February 2019.
What this record means for a decision
Durability is tested in the Acquisition District Screen; who can act, in the District Capital Plan and the Ground-Floor Strategy.
HALL CAPITAL ADVISORY FINDINGHALL CAPITAL ADVISORY THRESHOLDAn interpretation of the bands below, not a score, a rank or advice.
Median years businesses have traded inside this boundary.
WITHHELD2 dated businesses sit inside this boundary, under the floor of 25. The reading is withheld rather than banded on that few.Openings + closures per 100 starting businesses over four years.
WITHHELD4 ground-floor businesses stood inside this boundary at the start of the window, under the floor of 40. The reading is withheld rather than banded on that few.Ownership concentration: share of commercial accounts held by the largest private owner group.
9.70%A POSITION134 commercial accounts resolving to 87 owner groups.Structural context · No band or score
Structural presence mix
Baseline Presence is the structural context the three readings are read against. It carries no band and no score. Residents are the 2020 Census count and workers the LODES workplace count, each apportioned to this boundary by block area, with anyone who both lives and works inside the line counted once. It is not a count of observed pedestrian activity. 22 of the 46 census blocks this boundary meets lie wholly inside it.
PUBLIC DATAHALL CAPITAL ADVISORY DERIVED2020 Decennial Census P1_001N and LEHD LODES version 8.
Data status and source confidence
BOUNDARY STANDARDIZEDNOT CLASS A CERTIFIEDPasses all six gates and is not Class A certified. Six passed gates is not certification. No composite is shown: the controlled composite is withheld. How the six gates work.
Sources. Tenure and turnover: Texas Alcoholic Beverage Commission licenses and Texas Comptroller sales tax permits, joined to the parcel address. Ownership: Ector CAD certified real appraisal roll and surface parcel shapefile. Residents and workers: 2020 Decennial Census P1_001N and LEHD LODES version 8.
On the boundary itself The layer id is 2. A separate layer named Downtown Boundary carries no ordinance and is 3.5 times the adopted overlay, the sharpest adopted-versus-informal gap in the register.
| Gate | Requirement | Disposition | Ledger code |
|---|---|---|---|
| G1 | Official district geometry | Passed | VERIFIED_PASS |
| G2 | Broad establishment universe | Passed | VERIFIED_PASS |
| G3 | Valid start history | Passed | VERIFIED_PASS |
| G4 | Valid trailing 48-month exit history | Passed | VERIFIED_PASS |
| G5 | Standardized ownership | Passed | VERIFIED_PASS |
| G6 | Harmonized context | Passed | VERIFIED_PASS |
Read on Downtown Design Districts, 1,551 acres, rung 1, adopted downtown zoning district or overlay. Adopted under Oklahoma City Code Ch. 59 Art. VII sec. 59-7200.
What this record means for a decision
Durability is tested in the Acquisition District Screen; who can act, in the District Capital Plan and the Ground-Floor Strategy.
HALL CAPITAL ADVISORY FINDINGHALL CAPITAL ADVISORY THRESHOLDAn interpretation of the bands below, not a score, a rank or advice.
Median years businesses have traded inside this boundary.
WITHHELDNo dated business register covers this district.Openings + closures per 100 starting businesses over four years.
WITHHELDNo register carrying a closing date covers this district.Ownership concentration: share of commercial accounts held by the largest private owner group.
8.36%A POSITION1,137 commercial accounts resolving to 495 owner groups.Structural context · No band or score
Structural presence mix
Baseline Presence is the structural context the three readings are read against. It carries no band and no score. Residents are the 2020 Census count and workers the LODES workplace count, each apportioned to this boundary by block area, with anyone who both lives and works inside the line counted once. It is not a count of observed pedestrian activity. 234 of the 336 census blocks this boundary meets lie wholly inside it.
PUBLIC DATAHALL CAPITAL ADVISORY DERIVED2020 Decennial Census P1_001N and LEHD LODES version 8.
Data status and source confidence
BOUNDARY STANDARDIZEDNOT CLASS A CERTIFIEDNot Class A certified. 3 of six gates passed. No composite is shown: the controlled composite is withheld. How the six gates work.
Sources. Tenure and turnover: NOT AVAILABLE. Ownership: Oklahoma County Assessor tax parcels. Residents and workers: 2020 Decennial Census P1_001N and LEHD LODES version 8.
| Gate | Requirement | Disposition | Ledger code |
|---|---|---|---|
| G1 | Official district geometry | Passed | VERIFIED_PASS |
| G2 | Broad establishment universe | Source unavailable | BLOCKED_SOURCE_UNAVAILABLE |
| G3 | Valid start history | Source unavailable | BLOCKED_SOURCE_UNAVAILABLE |
| G4 | Valid trailing 48-month exit history | Source unavailable | BLOCKED_SOURCE_UNAVAILABLE |
| G5 | Standardized ownership | Passed | VERIFIED_PASS |
| G6 | Harmonized context | Passed | VERIFIED_PASS |
Read on Downtown Development Board area, 1,137 acres, rung 3, downtown-purposed special district. Adopted under Orlando Downtown Development Board.
What this record means for a decision
Durability is tested in the Acquisition District Screen; who can act, in the District Capital Plan and the Ground-Floor Strategy.
HALL CAPITAL ADVISORY FINDINGHALL CAPITAL ADVISORY THRESHOLDAn interpretation of the bands below, not a score, a rank or advice.
Median years businesses have traded inside this boundary.
7.39 yearsSETTLINGThe median across 4,498 businesses trading inside the line.Openings + closures per 100 starting businesses over four years.
113.3 per 100CHURNING2,621 opened and 3,681 closed against 5,560 ground-floor businesses at the start of the window.Ownership concentration: share of commercial accounts held by the largest private owner group.
8.11%A POSITION715 commercial accounts resolving to 433 owner groups.Structural context · No band or score
Structural presence mix
Baseline Presence is the structural context the three readings are read against. It carries no band and no score. Residents are the 2020 Census count and workers the LODES workplace count, each apportioned to this boundary by block area, with anyone who both lives and works inside the line counted once. It is not a count of observed pedestrian activity. 203 of the 278 census blocks this boundary meets lie wholly inside it.
PUBLIC DATAHALL CAPITAL ADVISORY DERIVED2020 Decennial Census P1_001N and LEHD LODES version 8.
Data status and source confidence
BOUNDARY STANDARDIZEDCLASS A CERTIFIEDHolds the governed Class A certification and passes all six gates. No composite is shown: the controlled composite is withheld. How the six gates work.
Sources. Tenure and turnover: City of Orlando Business Tax Receipts (7388-4re5). Ownership: Florida Statewide Cadastral, FGIO and FDOR, county 58. Residents and workers: 2020 Decennial Census P1_001N and LEHD LODES version 8.
| Gate | Requirement | Disposition | Ledger code |
|---|---|---|---|
| G1 | Official district geometry | Passed | VERIFIED_PASS |
| G2 | Broad establishment universe | Passed | VERIFIED_PASS |
| G3 | Valid start history | Passed | VERIFIED_PASS |
| G4 | Valid trailing 48-month exit history | Passed | VERIFIED_PASS |
| G5 | Standardized ownership | Passed | VERIFIED_PASS |
| G6 | Harmonized context | Passed | VERIFIED_PASS |
Read on Old Townsite zoning districts, 193 acres, rung 1, adopted downtown zoning district or overlay. Adopted under Pearland Unified Development Code chapter 2, ordinance 2000M and amendments.
What this record means for a decision
Durability is tested in the Acquisition District Screen; who can act, in the District Capital Plan and the Ground-Floor Strategy.
HALL CAPITAL ADVISORY FINDINGHALL CAPITAL ADVISORY THRESHOLDAn interpretation of the bands below, not a score, a rank or advice.
Median years businesses have traded inside this boundary.
4.85 yearsTHINThe median across 44 businesses trading inside the line.Openings + closures per 100 starting businesses over four years.
100.0 per 100CHURNING22 opened and 32 closed against 54 ground-floor businesses at the start of the window.Ownership concentration: share of commercial accounts held by the largest private owner group.
5.13%NO STANDING499 commercial accounts resolving to 96 owner groups.Structural context · No band or score
Structural presence mix
Baseline Presence is the structural context the three readings are read against. It carries no band and no score. Residents are the 2020 Census count and workers the LODES workplace count, each apportioned to this boundary by block area, with anyone who both lives and works inside the line counted once. It is not a count of observed pedestrian activity. 4 of the 53 census blocks this boundary meets lie wholly inside it.
PUBLIC DATAHALL CAPITAL ADVISORY DERIVED2020 Decennial Census P1_001N and LEHD LODES version 8.
Data status and source confidence
BOUNDARY STANDARDIZEDCERTIFICATION SUSPENDEDA strict peer holding 5 of six passes. Its membership is unchanged and its certification is suspended until it holds six admissible passes. No composite is shown: the controlled composite is withheld. How the six gates work.
Sources. Tenure and turnover: Texas Alcoholic Beverage Commission licenses and Texas Comptroller sales tax permits, joined to the parcel address. Ownership: Brazoria CAD appraisal export, APPRAISAL_INFO.TXT. Residents and workers: 2020 Decennial Census P1_001N and LEHD LODES version 8.
On the boundary itself Pearland's TIRZ 2 is 3,932 acres and is Shadow Creek Ranch, not downtown.
| Gate | Requirement | Disposition | Ledger code |
|---|---|---|---|
| G1 | Official district geometry | Passed | VERIFIED_PASS |
| G2 | Broad establishment universe | Passed | VERIFIED_PASS |
| G3 | Valid start history | Passed | VERIFIED_PASS |
| G4 | Valid trailing 48-month exit history | Passed | VERIFIED_PASS |
| G5 | Standardized ownership | Passed | VERIFIED_PASS |
| G6 | Harmonized context | Refused on measurement: adopted footprint conflict | REFUSED_ON_MEASUREMENT_ADOPTED_FOOTPRINT_CONFLICT |
Read on Main Street district parcels, 50 acres, rung 4, Main Street or historic district. Adopted under Texas Main Street self-initiated designation 2001, state designation 2002.
What this record means for a decision
Durability is tested in the Acquisition District Screen; who can act, in the District Capital Plan and the Ground-Floor Strategy.
HALL CAPITAL ADVISORY FINDINGHALL CAPITAL ADVISORY THRESHOLDAn interpretation of the bands below, not a score, a rank or advice.
Median years businesses have traded inside this boundary.
WITHHELD4 dated businesses sit inside this boundary, under the floor of 25. The reading is withheld rather than banded on that few.Openings + closures per 100 starting businesses over four years.
WITHHELD11 ground-floor businesses stood inside this boundary at the start of the window, under the floor of 40. The reading is withheld rather than banded on that few.Ownership concentration: share of commercial accounts held by the largest private owner group.
5.04%NO STANDING139 commercial accounts resolving to 89 owner groups.Structural context · No band or score
Structural presence mix
Baseline Presence is the structural context the three readings are read against. It carries no band and no score. Residents are the 2020 Census count and workers the LODES workplace count, each apportioned to this boundary by block area, with anyone who both lives and works inside the line counted once. It is not a count of observed pedestrian activity. 0 of the 30 census blocks this boundary meets lie wholly inside it.
PUBLIC DATAHALL CAPITAL ADVISORY DERIVED2020 Decennial Census P1_001N and LEHD LODES version 8.
Data status and source confidence
BOUNDARY STANDARDIZEDNOT CLASS A CERTIFIEDNot Class A certified. 2 of six gates passed. No composite is shown: the controlled composite is withheld. How the six gates work.
Sources. Tenure and turnover: Texas Alcoholic Beverage Commission licenses and Texas Comptroller sales tax permits, joined to the parcel address. Ownership: Hidalgo CAD parcel and appraisal export, HCADShapefiles. Residents and workers: 2020 Decennial Census P1_001N and LEHD LODES version 8.
On the boundary itself Parcels only, so street right-of-way is excluded and the area understates a street-inclusive downtown by roughly two fifths. Pharr does not appear on the Historical Commission's current participating list, so the designation has lapsed. Its TIRZ spreads over eleven miles and is not downtown.
| Gate | Requirement | Disposition | Ledger code |
|---|---|---|---|
| G1 | Official district geometry | Passed | VERIFIED_PASS |
| G2 | Broad establishment universe | Refused on measurement: adopted footprint conflict | REFUSED_ON_MEASUREMENT_ADOPTED_FOOTPRINT_CONFLICT |
| G3 | Valid start history | Refused on measurement: adopted footprint conflict | REFUSED_ON_MEASUREMENT_ADOPTED_FOOTPRINT_CONFLICT |
| G4 | Valid trailing 48-month exit history | Refused on measurement: adopted footprint conflict | REFUSED_ON_MEASUREMENT_ADOPTED_FOOTPRINT_CONFLICT |
| G5 | Standardized ownership | Passed | VERIFIED_PASS |
| G6 | Harmonized context | Refused on measurement: adopted footprint conflict | REFUSED_ON_MEASUREMENT_ADOPTED_FOOTPRINT_CONFLICT |
Read on Center City District, 560 acres, rung 3, downtown-purposed special district. Adopted under Philadelphia Bill No. 220846.
What this record means for a decision
Durability is tested in the Acquisition District Screen; who can act, in the District Capital Plan and the Ground-Floor Strategy.
HALL CAPITAL ADVISORY FINDINGHALL CAPITAL ADVISORY THRESHOLDAn interpretation of the bands below, not a score, a rank or advice.
Median years businesses have traded inside this boundary.
13.83 yearsSETTLINGThe median across 3,832 businesses trading inside the line.Openings + closures per 100 starting businesses over four years.
36.4 per 100HELD761 opened and 562 closed against 3,633 ground-floor businesses at the start of the window.Ownership concentration: share of commercial accounts held by the largest private owner group.
2.07%NO STANDING1,355 commercial accounts resolving to 965 owner groups.Structural context · No band or score
Structural presence mix
Baseline Presence is the structural context the three readings are read against. It carries no band and no score. Residents are the 2020 Census count and workers the LODES workplace count, each apportioned to this boundary by block area, with anyone who both lives and works inside the line counted once. It is not a count of observed pedestrian activity. 198 of the 313 census blocks this boundary meets lie wholly inside it.
PUBLIC DATAHALL CAPITAL ADVISORY DERIVED2020 Decennial Census P1_001N and LEHD LODES version 8.
Data status and source confidence
BOUNDARY STANDARDIZEDCLASS A CERTIFIEDHolds the governed Class A certification and passes all six gates. No composite is shown: the controlled composite is withheld. How the six gates work.
Sources. Tenure and turnover: Philadelphia L&I Business Licenses. Ownership: Philadelphia OPA opa_properties_public. Residents and workers: 2020 Decennial Census P1_001N and LEHD LODES version 8.
| Gate | Requirement | Disposition | Ledger code |
|---|---|---|---|
| G1 | Official district geometry | Passed | VERIFIED_PASS |
| G2 | Broad establishment universe | Passed | VERIFIED_PASS |
| G3 | Valid start history | Passed | VERIFIED_PASS |
| G4 | Valid trailing 48-month exit history | Passed | VERIFIED_PASS |
| G5 | Standardized ownership | Passed | VERIFIED_PASS |
| G6 | Harmonized context | Passed | VERIFIED_PASS |
Read on BG Downtown Business/Government zoning, 142 acres, rung 1, adopted downtown zoning district or overlay. Adopted under City zoning district.
What this record means for a decision
Durability is tested in the Acquisition District Screen; who can act, in the District Capital Plan and the Ground-Floor Strategy.
HALL CAPITAL ADVISORY FINDINGHALL CAPITAL ADVISORY THRESHOLDAn interpretation of the bands below, not a score, a rank or advice.
Median years businesses have traded inside this boundary.
WITHHELD12 dated businesses sit inside this boundary, under the floor of 25. The reading is withheld rather than banded on that few.Openings + closures per 100 starting businesses over four years.
WITHHELD14 ground-floor businesses stood inside this boundary at the start of the window, under the floor of 40. The reading is withheld rather than banded on that few.Ownership concentration: share of commercial accounts held by the largest private owner group.
3.76%NO STANDINGprovisional133 commercial accounts resolving to 72 owner groups.Structural context · No band or score
Structural presence mix
Baseline Presence is the structural context the three readings are read against. It carries no band and no score. Residents are the 2020 Census count and workers the LODES workplace count, each apportioned to this boundary by block area, with anyone who both lives and works inside the line counted once. It is not a count of observed pedestrian activity. 13 of the 53 census blocks this boundary meets lie wholly inside it.
PUBLIC DATAHALL CAPITAL ADVISORY DERIVED2020 Decennial Census P1_001N and LEHD LODES version 8.
Data status and source confidence
BOUNDARY STANDARDIZEDNOT CLASS A CERTIFIEDNot Class A certified. 0 of six gates passed. No composite is shown: the controlled composite is withheld. How the six gates work.
Sources. Tenure and turnover: Texas Alcoholic Beverage Commission licenses and Texas Comptroller sales tax permits, joined to the parcel address. Ownership: Collin CAD property roll, data.texas.gov 5tkr-3759. Residents and workers: 2020 Decennial Census P1_001N and LEHD LODES version 8.
| Gate | Requirement | Disposition | Ledger code |
|---|---|---|---|
| G1 | Official district geometry | Refused on measurement: declared acreage conflict | REFUSED_ON_MEASUREMENT_DECLARED_ACREAGE_CONFLICT |
| G2 | Broad establishment universe | Refused on measurement: g1 dependency unresolved | REFUSED_ON_MEASUREMENT_G1_DEPENDENCY_UNRESOLVED |
| G3 | Valid start history | Refused on measurement: g1 dependency unresolved | REFUSED_ON_MEASUREMENT_G1_DEPENDENCY_UNRESOLVED |
| G4 | Valid trailing 48-month exit history | Refused on measurement: g1 dependency unresolved | REFUSED_ON_MEASUREMENT_G1_DEPENDENCY_UNRESOLVED |
| G5 | Standardized ownership | Refused on measurement: g1 dependency unresolved | REFUSED_ON_MEASUREMENT_G1_DEPENDENCY_UNRESOLVED |
| G6 | Harmonized context | Refused on measurement: g1 dependency unresolved | REFUSED_ON_MEASUREMENT_G1_DEPENDENCY_UNRESOLVED |
Read on Central City Plan District, 2,972 acres, rung 1, adopted downtown zoning district or overlay. Adopted under Portland City Code Title 33 Chapter 33.510.
What this record means for a decision
Durability is tested in the Acquisition District Screen; who can act, in the District Capital Plan and the Ground-Floor Strategy.
HALL CAPITAL ADVISORY FINDINGHALL CAPITAL ADVISORY THRESHOLDAn interpretation of the bands below, not a score, a rank or advice.
Median years businesses have traded inside this boundary.
WITHHELDNo dated business register covers this district.Openings + closures per 100 starting businesses over four years.
WITHHELDNo register carrying a closing date covers this district.Ownership concentration: share of commercial accounts held by the largest private owner group.
1.37%NO STANDINGprovisional2,334 commercial accounts resolving to 1,146 owner groups.Structural context · No band or score
Structural presence mix
Baseline Presence is the structural context the three readings are read against. It carries no band and no score. Residents are the 2020 Census count and workers the LODES workplace count, each apportioned to this boundary by block area, with anyone who both lives and works inside the line counted once. It is not a count of observed pedestrian activity. 978 of the 1,174 census blocks this boundary meets lie wholly inside it.
PUBLIC DATAHALL CAPITAL ADVISORY DERIVED2020 Decennial Census P1_001N and LEHD LODES version 8.
Data status and source confidence
BOUNDARY STANDARDIZEDNOT CLASS A CERTIFIEDNot Class A certified. 1 of six gates passed. No composite is shown: the controlled composite is withheld. How the six gates work.
Sources. Tenure and turnover: NOT AVAILABLE. Ownership: Metro regional taxlots, Multnomah County (COUNTY = M). Residents and workers: 2020 Decennial Census P1_001N and LEHD LODES version 8.
| Gate | Requirement | Disposition | Ledger code |
|---|---|---|---|
| G1 | Official district geometry | Passed | VERIFIED_PASS |
| G2 | Broad establishment universe | Source unavailable | BLOCKED_SOURCE_UNAVAILABLE |
| G3 | Valid start history | Source unavailable | BLOCKED_SOURCE_UNAVAILABLE |
| G4 | Valid trailing 48-month exit history | Source unavailable | BLOCKED_SOURCE_UNAVAILABLE |
| G5 | Standardized ownership | Refused on measurement: superseded published footprint | REFUSED_ON_MEASUREMENT_SUPERSEDED_PUBLISHED_FOOTPRINT |
| G6 | Harmonized context | Refused on measurement: superseded published footprint | REFUSED_ON_MEASUREMENT_SUPERSEDED_PUBLISHED_FOOTPRINT |
Read on Downtown Mixed Use districts, 648 acres, rung 1, adopted downtown zoning district or overlay. Adopted under Raleigh Unified Development Ordinance Ch. 3.
What this record means for a decision
Durability is tested in the Acquisition District Screen; who can act, in the District Capital Plan and the Ground-Floor Strategy.
HALL CAPITAL ADVISORY FINDINGHALL CAPITAL ADVISORY THRESHOLDAn interpretation of the bands below, not a score, a rank or advice.
Median years businesses have traded inside this boundary.
3.59 yearsTHINprovisionalThe median across 137 businesses trading inside the line.Openings + closures per 100 starting businesses over four years.
WITHHELDNo register carrying a closing date covers this district.Ownership concentration: share of commercial accounts held by the largest private owner group.
4.56%NO STANDINGprovisional285 commercial accounts resolving to 185 owner groups.Structural context · No band or score
Structural presence mix
Baseline Presence is the structural context the three readings are read against. It carries no band and no score. Residents are the 2020 Census count and workers the LODES workplace count, each apportioned to this boundary by block area, with anyone who both lives and works inside the line counted once. It is not a count of observed pedestrian activity. 93 of the 174 census blocks this boundary meets lie wholly inside it.
PUBLIC DATAHALL CAPITAL ADVISORY DERIVED2020 Decennial Census P1_001N and LEHD LODES version 8.
Data status and source confidence
BOUNDARY STANDARDIZEDNOT CLASS A CERTIFIEDNot Class A certified. 1 of six gates passed. No composite is shown: the controlled composite is withheld. How the six gates work.
Sources. Tenure and turnover: North Carolina ABC Commission bulk permit export, Raleigh. Ownership: Wake County real estate parcels. Residents and workers: 2020 Decennial Census P1_001N and LEHD LODES version 8.
| Gate | Requirement | Disposition | Ledger code |
|---|---|---|---|
| G1 | Official district geometry | Passed | VERIFIED_PASS |
| G2 | Broad establishment universe | Source unavailable | BLOCKED_SOURCE_UNAVAILABLE |
| G3 | Valid start history | Source unavailable | BLOCKED_SOURCE_UNAVAILABLE |
| G4 | Valid trailing 48-month exit history | Source unavailable | BLOCKED_SOURCE_UNAVAILABLE |
| G5 | Standardized ownership | Refused on measurement: superseded published footprint | REFUSED_ON_MEASUREMENT_SUPERSEDED_PUBLISHED_FOOTPRINT |
| G6 | Harmonized context | Refused on measurement: superseded published footprint | REFUSED_ON_MEASUREMENT_SUPERSEDED_PUBLISHED_FOOTPRINT |
Read on CORE District, Downtown sub-district, 124 acres, rung 1, adopted downtown zoning district or overlay. Adopted under City district branding; no adopting ordinance confirmed.
What this record means for a decision
Durability is tested in the Acquisition District Screen; who can act, in the District Capital Plan and the Ground-Floor Strategy.
HALL CAPITAL ADVISORY FINDINGHALL CAPITAL ADVISORY THRESHOLDAn interpretation of the bands below, not a score, a rank or advice.
Median years businesses have traded inside this boundary.
WITHHELD2 dated businesses sit inside this boundary, under the floor of 25. The reading is withheld rather than banded on that few.Openings + closures per 100 starting businesses over four years.
WITHHELD8 ground-floor businesses stood inside this boundary at the start of the window, under the floor of 40. The reading is withheld rather than banded on that few.Ownership concentration: share of commercial accounts held by the largest private owner group.
8.80%A POSITIONprovisional125 commercial accounts resolving to 61 owner groups.Structural context · No band or score
Structural presence mix
Baseline Presence is the structural context the three readings are read against. It carries no band and no score. Residents are the 2020 Census count and workers the LODES workplace count, each apportioned to this boundary by block area, with anyone who both lives and works inside the line counted once. It is not a count of observed pedestrian activity. 18 of the 36 census blocks this boundary meets lie wholly inside it.
PUBLIC DATAHALL CAPITAL ADVISORY DERIVED2020 Decennial Census P1_001N and LEHD LODES version 8.
Data status and source confidence
BOUNDARY STANDARDIZEDNOT CLASS A CERTIFIEDNot Class A certified. 0 of six gates passed. No composite is shown: the controlled composite is withheld. How the six gates work.
Sources. Tenure and turnover: Texas Alcoholic Beverage Commission licenses and Texas Comptroller sales tax permits, joined to the parcel address. Ownership: Dallas CAD certified roll, joined with the second county's roll. Residents and workers: 2020 Decennial Census P1_001N and LEHD LODES version 8.
On the boundary itself Richardson has no conventional downtown and brands this area the CORE District. The adopting ordinance could not be confirmed, so the rung is provisional. The Main Street form-based code area is 537 acres, 4.3 times this boundary.
| Gate | Requirement | Disposition | Ledger code |
|---|---|---|---|
| G1 | Official district geometry | Refused on measurement: adoption authority unsupported | REFUSED_ON_MEASUREMENT_ADOPTION_AUTHORITY_UNSUPPORTED |
| G2 | Broad establishment universe | Refused on measurement: g1 dependency unresolved | REFUSED_ON_MEASUREMENT_G1_DEPENDENCY_UNRESOLVED |
| G3 | Valid start history | Refused on measurement: g1 dependency unresolved | REFUSED_ON_MEASUREMENT_G1_DEPENDENCY_UNRESOLVED |
| G4 | Valid trailing 48-month exit history | Refused on measurement: g1 dependency unresolved | REFUSED_ON_MEASUREMENT_G1_DEPENDENCY_UNRESOLVED |
| G5 | Standardized ownership | Refused on measurement: g1 dependency unresolved | REFUSED_ON_MEASUREMENT_G1_DEPENDENCY_UNRESOLVED |
| G6 | Harmonized context | Refused on measurement: g1 dependency unresolved | REFUSED_ON_MEASUREMENT_G1_DEPENDENCY_UNRESOLVED |
Read on Downtown Mixed Use Amendment Area, 352 acres, rung 2, adopted downtown plan area. Adopted under City planning boundary, 11 April 2024.
What this record means for a decision
Durability is tested in the Acquisition District Screen; who can act, in the District Capital Plan and the Ground-Floor Strategy.
HALL CAPITAL ADVISORY FINDINGHALL CAPITAL ADVISORY THRESHOLDAn interpretation of the bands below, not a score, a rank or advice.
Median years businesses have traded inside this boundary.
WITHHELD24 dated businesses sit inside this boundary, under the floor of 25. The reading is withheld rather than banded on that few.Openings + closures per 100 starting businesses over four years.
WITHHELD34 ground-floor businesses stood inside this boundary at the start of the window, under the floor of 40. The reading is withheld rather than banded on that few.Ownership concentration: share of commercial accounts held by the largest private owner group.
3.23%NO STANDING155 commercial accounts resolving to 127 owner groups.Structural context · No band or score
Structural presence mix
Baseline Presence is the structural context the three readings are read against. It carries no band and no score. Residents are the 2020 Census count and workers the LODES workplace count, each apportioned to this boundary by block area, with anyone who both lives and works inside the line counted once. It is not a count of observed pedestrian activity. 73 of the 92 census blocks this boundary meets lie wholly inside it.
PUBLIC DATAHALL CAPITAL ADVISORY DERIVED2020 Decennial Census P1_001N and LEHD LODES version 8.
Data status and source confidence
BOUNDARY STANDARDIZEDNOT CLASS A CERTIFIEDNot Class A certified. 3 of six gates passed. No composite is shown: the controlled composite is withheld. How the six gates work.
Sources. Tenure and turnover: Texas Alcoholic Beverage Commission licenses and Texas Comptroller sales tax permits, joined to the parcel address. Ownership: Williamson CAD open data, PropOwner and PropertyDataExport. Residents and workers: 2020 Decennial Census P1_001N and LEHD LODES version 8.
On the boundary itself The layer id is 1, not 0.
| Gate | Requirement | Disposition | Ledger code |
|---|---|---|---|
| G1 | Official district geometry | Passed | VERIFIED_PASS |
| G2 | Broad establishment universe | Refused on measurement: placement set materially incomplete | REFUSED_ON_MEASUREMENT_PLACEMENT_SET_MATERIALLY_INCOMPLETE |
| G3 | Valid start history | Refused on measurement: placement set materially incomplete | REFUSED_ON_MEASUREMENT_PLACEMENT_SET_MATERIALLY_INCOMPLETE |
| G4 | Valid trailing 48-month exit history | Refused on measurement: placement set materially incomplete | REFUSED_ON_MEASUREMENT_PLACEMENT_SET_MATERIALLY_INCOMPLETE |
| G5 | Standardized ownership | Passed | VERIFIED_PASS |
| G6 | Harmonized context | Passed | VERIFIED_PASS |
Read on C-3 Central Business District zone, 302 acres, rung 1, adopted downtown zoning district or overlay. Adopted under Sacramento City Code Title 17 Ch. 17.216 Art. VIII.
What this record means for a decision
Durability is tested in the Acquisition District Screen; who can act, in the District Capital Plan and the Ground-Floor Strategy.
HALL CAPITAL ADVISORY FINDINGHALL CAPITAL ADVISORY THRESHOLDAn interpretation of the bands below, not a score, a rank or advice.
Median years businesses have traded inside this boundary.
7.32 yearsSETTLINGprovisionalThe median across 1,060 businesses trading inside the line.Openings + closures per 100 starting businesses over four years.
79.0 per 100REPLACINGprovisional436 opened and 271 closed against 895 ground-floor businesses at the start of the window.Ownership concentration: share of commercial accounts held by the largest private owner group.
WITHHELDNo owner name is published inside this boundary.Structural context · No band or score
Structural presence mix
Baseline Presence is the structural context the three readings are read against. It carries no band and no score. Residents are the 2020 Census count and workers the LODES workplace count, each apportioned to this boundary by block area, with anyone who both lives and works inside the line counted once. It is not a count of observed pedestrian activity. 42 of the 118 census blocks this boundary meets lie wholly inside it.
PUBLIC DATAHALL CAPITAL ADVISORY DERIVED2020 Decennial Census P1_001N and LEHD LODES version 8.
Data status and source confidence
BOUNDARY STANDARDIZEDNOT CLASS A CERTIFIEDNot Class A certified. 1 of six gates passed. No composite is shown: the controlled composite is withheld. How the six gates work.
Sources. Tenure and turnover: City of Sacramento business operation tax information. Ownership: NOT AVAILABLE. Residents and workers: 2020 Decennial Census P1_001N and LEHD LODES version 8.
| Gate | Requirement | Disposition | Ledger code |
|---|---|---|---|
| G1 | Official district geometry | Passed | VERIFIED_PASS |
| G2 | Broad establishment universe | Refused on measurement: adopted footprint conflict | REFUSED_ON_MEASUREMENT_ADOPTED_FOOTPRINT_CONFLICT |
| G3 | Valid start history | Refused on measurement: adopted footprint conflict | REFUSED_ON_MEASUREMENT_ADOPTED_FOOTPRINT_CONFLICT |
| G4 | Valid trailing 48-month exit history | Refused on measurement: adopted footprint conflict | REFUSED_ON_MEASUREMENT_ADOPTED_FOOTPRINT_CONFLICT |
| G5 | Standardized ownership | Source unavailable | BLOCKED_SOURCE_UNAVAILABLE |
| G6 | Harmonized context | Refused on measurement: adopted footprint conflict | REFUSED_ON_MEASUREMENT_ADOPTED_FOOTPRINT_CONFLICT |
Read on D-1 Central Business District, 252 acres, rung 1, adopted downtown zoning district or overlay. Adopted under Salt Lake City Code sec. 21A.30.020.
What this record means for a decision
Durability is tested in the Acquisition District Screen; who can act, in the District Capital Plan and the Ground-Floor Strategy.
HALL CAPITAL ADVISORY FINDINGHALL CAPITAL ADVISORY THRESHOLDAn interpretation of the bands below, not a score, a rank or advice.
Median years businesses have traded inside this boundary.
WITHHELDNo dated business register covers this district.Openings + closures per 100 starting businesses over four years.
WITHHELDNo register carrying a closing date covers this district.Ownership concentration: share of commercial accounts held by the largest private owner group.
15.78%APPROACHING507 commercial accounts resolving to 182 owner groups.Structural context · No band or score
Structural presence mix
Baseline Presence is the structural context the three readings are read against. It carries no band and no score. Residents are the 2020 Census count and workers the LODES workplace count, each apportioned to this boundary by block area, with anyone who both lives and works inside the line counted once. It is not a count of observed pedestrian activity. 1 of the 47 census blocks this boundary meets lie wholly inside it.
PUBLIC DATAHALL CAPITAL ADVISORY DERIVED2020 Decennial Census P1_001N and LEHD LODES version 8.
Data status and source confidence
BOUNDARY STANDARDIZEDNOT CLASS A CERTIFIEDNot Class A certified. 2 of six gates passed. No composite is shown: the controlled composite is withheld. How the six gates work.
Sources. Tenure and turnover: NOT AVAILABLE. Ownership: Salt Lake County assessor parcels (Parcel Viewer service). Residents and workers: 2020 Decennial Census P1_001N and LEHD LODES version 8.
| Gate | Requirement | Disposition | Ledger code |
|---|---|---|---|
| G1 | Official district geometry | Passed | VERIFIED_PASS |
| G2 | Broad establishment universe | Refused on measurement: adopted footprint conflict | REFUSED_ON_MEASUREMENT_ADOPTED_FOOTPRINT_CONFLICT |
| G3 | Valid start history | Refused on measurement: adopted footprint conflict | REFUSED_ON_MEASUREMENT_ADOPTED_FOOTPRINT_CONFLICT |
| G4 | Valid trailing 48-month exit history | Refused on measurement: adopted footprint conflict | REFUSED_ON_MEASUREMENT_ADOPTED_FOOTPRINT_CONFLICT |
| G5 | Standardized ownership | Passed | VERIFIED_PASS |
| G6 | Harmonized context | Refused on measurement: adopted footprint conflict | REFUSED_ON_MEASUREMENT_ADOPTED_FOOTPRINT_CONFLICT |
Read on Central Business District, 1,614 acres, rung 1, adopted downtown zoning district or overlay. Adopted under City ordinance 61209, carried in the data.
What this record means for a decision
Durability is tested in the Acquisition District Screen; who can act, in the District Capital Plan and the Ground-Floor Strategy.
HALL CAPITAL ADVISORY FINDINGHALL CAPITAL ADVISORY THRESHOLDAn interpretation of the bands below, not a score, a rank or advice.
Median years businesses have traded inside this boundary.
6.94 yearsSETTLINGThe median across 1,292 businesses trading inside the line.Openings + closures per 100 starting businesses over four years.
92.3 per 100CHURNING599 opened and 526 closed against 1,219 ground-floor businesses at the start of the window.Ownership concentration: share of commercial accounts held by the largest private owner group.
2.73%NO STANDING962 commercial accounts resolving to 473 owner groups.Structural context · No band or score
Structural presence mix
Baseline Presence is the structural context the three readings are read against. It carries no band and no score. Residents are the 2020 Census count and workers the LODES workplace count, each apportioned to this boundary by block area, with anyone who both lives and works inside the line counted once. It is not a count of observed pedestrian activity. 371 of the 438 census blocks this boundary meets lie wholly inside it.
PUBLIC DATAHALL CAPITAL ADVISORY DERIVED2020 Decennial Census P1_001N and LEHD LODES version 8.
Data status and source confidence
BOUNDARY DISPLAYED — PROVENANCE MIGRATION PENDINGCLASS A CERTIFIEDHolds the governed Class A certification and passes all six gates. No composite is shown: the controlled composite is withheld. How the six gates work.
Sources. Tenure and turnover: Texas Alcoholic Beverage Commission licenses and Texas Comptroller sales tax permits, joined to the parcel address. Ownership: Bexar AD attributes republished by the San Antonio River Authority. Residents and workers: 2020 Decennial Census P1_001N and LEHD LODES version 8.
| Gate | Requirement | Disposition | Ledger code |
|---|---|---|---|
| G1 | Official district geometry | Passed | VERIFIED_PASS |
| G2 | Broad establishment universe | Passed | VERIFIED_PASS |
| G3 | Valid start history | Passed | VERIFIED_PASS |
| G4 | Valid trailing 48-month exit history | Passed | VERIFIED_PASS |
| G5 | Standardized ownership | Passed | VERIFIED_PASS |
| G6 | Harmonized context | Passed | VERIFIED_PASS |
Read on Centre City Planned District, 1,035 acres, rung 1, adopted downtown zoning district or overlay. Adopted under San Diego Municipal Code Ch. 15 Art. 6 Div. 1.
What this record means for a decision
Durability is tested in the Acquisition District Screen; who can act, in the District Capital Plan and the Ground-Floor Strategy.
HALL CAPITAL ADVISORY FINDINGHALL CAPITAL ADVISORY THRESHOLDAn interpretation of the bands below, not a score, a rank or advice.
Median years businesses have traded inside this boundary.
9.26 yearsSETTLINGThe median across 2,307 businesses trading inside the line.Openings + closures per 100 starting businesses over four years.
110.9 per 100CHURNINGprovisional1,282 opened and 1,326 closed against 2,351 ground-floor businesses at the start of the window.Ownership concentration: share of commercial accounts held by the largest private owner group.
2.94%NO STANDING1,499 commercial accounts resolving to 801 owner groups.Structural context · No band or score
Structural presence mix
Baseline Presence is the structural context the three readings are read against. It carries no band and no score. Residents are the 2020 Census count and workers the LODES workplace count, each apportioned to this boundary by block area, with anyone who both lives and works inside the line counted once. It is not a count of observed pedestrian activity. 273 of the 348 census blocks this boundary meets lie wholly inside it.
PUBLIC DATAHALL CAPITAL ADVISORY DERIVED2020 Decennial Census P1_001N and LEHD LODES version 8.
Data status and source confidence
BOUNDARY STANDARDIZEDNOT CLASS A CERTIFIEDNot Class A certified. 5 of six gates passed. No composite is shown: the controlled composite is withheld. How the six gates work.
Sources. Tenure and turnover: City of San Diego business tax certificates, six files, active and inactive back to before 1990. Ownership: San Diego County Assessor parcels (PPM_Public). Residents and workers: 2020 Decennial Census P1_001N and LEHD LODES version 8.
| Gate | Requirement | Disposition | Ledger code |
|---|---|---|---|
| G1 | Official district geometry | Passed | VERIFIED_PASS |
| G2 | Broad establishment universe | Passed | VERIFIED_PASS |
| G3 | Valid start history | Passed | VERIFIED_PASS |
| G4 | Valid trailing 48-month exit history | Refused on measurement: external field required | REFUSED_ON_MEASUREMENT_EXTERNAL_FIELD_REQUIRED |
| G5 | Standardized ownership | Passed | VERIFIED_PASS |
| G6 | Harmonized context | Passed | VERIFIED_PASS |
Read on C-3 Downtown Commercial Districts, 551 acres, rung 1, adopted downtown zoning district or overlay. Adopted under San Francisco Planning Code sec. 210.2.
What this record means for a decision
Durability is tested in the Acquisition District Screen; who can act, in the District Capital Plan and the Ground-Floor Strategy.
HALL CAPITAL ADVISORY FINDINGHALL CAPITAL ADVISORY THRESHOLDAn interpretation of the bands below, not a score, a rank or advice.
Median years businesses have traded inside this boundary.
8.96 yearsSETTLINGprovisionalThe median across 18,690 businesses trading inside the line.Openings + closures per 100 starting businesses over four years.
66.1 per 100CYCLINGprovisional6,417 opened and 5,034 closed against 17,312 ground-floor businesses at the start of the window.Ownership concentration: share of commercial accounts held by the largest private owner group.
WITHHELDNo owner name is published inside this boundary.Structural context · No band or score
Structural presence mix
Baseline Presence is the structural context the three readings are read against. It carries no band and no score. Residents are the 2020 Census count and workers the LODES workplace count, each apportioned to this boundary by block area, with anyone who both lives and works inside the line counted once. It is not a count of observed pedestrian activity. 53 of the 209 census blocks this boundary meets lie wholly inside it.
PUBLIC DATAHALL CAPITAL ADVISORY DERIVED2020 Decennial Census P1_001N and LEHD LODES version 8.
Data status and source confidence
BOUNDARY STANDARDIZEDNOT CLASS A CERTIFIEDNot Class A certified. 1 of six gates passed. No composite is shown: the controlled composite is withheld. How the six gates work.
Sources. Tenure and turnover: San Francisco Registered Business Locations (g8m3-pdis). Ownership: NOT AVAILABLE. Residents and workers: 2020 Decennial Census P1_001N and LEHD LODES version 8.
| Gate | Requirement | Disposition | Ledger code |
|---|---|---|---|
| G1 | Official district geometry | Passed | VERIFIED_PASS |
| G2 | Broad establishment universe | Refused on measurement: adopted footprint conflict | REFUSED_ON_MEASUREMENT_ADOPTED_FOOTPRINT_CONFLICT |
| G3 | Valid start history | Refused on measurement: adopted footprint conflict | REFUSED_ON_MEASUREMENT_ADOPTED_FOOTPRINT_CONFLICT |
| G4 | Valid trailing 48-month exit history | Refused on measurement: adopted footprint conflict | REFUSED_ON_MEASUREMENT_ADOPTED_FOOTPRINT_CONFLICT |
| G5 | Standardized ownership | Source unavailable | BLOCKED_SOURCE_UNAVAILABLE |
| G6 | Harmonized context | Refused on measurement: adopted footprint conflict | REFUSED_ON_MEASUREMENT_ADOPTED_FOOTPRINT_CONFLICT |
Read on Downtown Primary Commercial districts, 367 acres, rung 1, adopted downtown zoning district or overlay. Adopted under San Jose Municipal Code Title 20 Ch. 20.70.
What this record means for a decision
Durability is tested in the Acquisition District Screen; who can act, in the District Capital Plan and the Ground-Floor Strategy.
HALL CAPITAL ADVISORY FINDINGHALL CAPITAL ADVISORY THRESHOLDAn interpretation of the bands below, not a score, a rank or advice.
Median years businesses have traded inside this boundary.
WITHHELDNo dated business register covers this district.Openings + closures per 100 starting businesses over four years.
WITHHELDNo register carrying a closing date covers this district.Ownership concentration: share of commercial accounts held by the largest private owner group.
9.42%A POSITIONprovisional499 commercial accounts resolving to 261 owner groups.Structural context · No band or score
Structural presence mix
Baseline Presence is the structural context the three readings are read against. It carries no band and no score. Residents are the 2020 Census count and workers the LODES workplace count, each apportioned to this boundary by block area, with anyone who both lives and works inside the line counted once. It is not a count of observed pedestrian activity. 16 of the 151 census blocks this boundary meets lie wholly inside it.
PUBLIC DATAHALL CAPITAL ADVISORY DERIVED2020 Decennial Census P1_001N and LEHD LODES version 8.
Data status and source confidence
BOUNDARY STANDARDIZEDNOT CLASS A CERTIFIEDNot Class A certified. 1 of six gates passed. No composite is shown: the controlled composite is withheld. How the six gates work.
Sources. Tenure and turnover: NOT AVAILABLE. Ownership: Santa Clara County assessment roll via the City of San Jose. Residents and workers: 2020 Decennial Census P1_001N and LEHD LODES version 8.
| Gate | Requirement | Disposition | Ledger code |
|---|---|---|---|
| G1 | Official district geometry | Passed | VERIFIED_PASS |
| G2 | Broad establishment universe | Refused on measurement: adopted footprint conflict | REFUSED_ON_MEASUREMENT_ADOPTED_FOOTPRINT_CONFLICT |
| G3 | Valid start history | Refused on measurement: adopted footprint conflict | REFUSED_ON_MEASUREMENT_ADOPTED_FOOTPRINT_CONFLICT |
| G4 | Valid trailing 48-month exit history | Refused on measurement: adopted footprint conflict | REFUSED_ON_MEASUREMENT_ADOPTED_FOOTPRINT_CONFLICT |
| G5 | Standardized ownership | Source unavailable | BLOCKED_SOURCE_UNAVAILABLE |
| G6 | Harmonized context | Refused on measurement: adopted footprint conflict | REFUSED_ON_MEASUREMENT_ADOPTED_FOOTPRINT_CONFLICT |
Read on Downtown zoning designations, 972 acres, rung 1, adopted downtown zoning district or overlay. Adopted under Seattle Municipal Code Chapter 23.49.
What this record means for a decision
Durability is tested in the Acquisition District Screen; who can act, in the District Capital Plan and the Ground-Floor Strategy.
HALL CAPITAL ADVISORY FINDINGHALL CAPITAL ADVISORY THRESHOLDAn interpretation of the bands below, not a score, a rank or advice.
Median years businesses have traded inside this boundary.
9.45 yearsSETTLINGThe median across 7,368 businesses trading inside the line.Openings + closures per 100 starting businesses over four years.
WITHHELDNo register carrying a closing date covers this district.Ownership concentration: share of commercial accounts held by the largest private owner group.
2.06%NO STANDINGprovisional875 commercial accounts resolving to 595 owner groups.Structural context · No band or score
Structural presence mix
Baseline Presence is the structural context the three readings are read against. It carries no band and no score. Residents are the 2020 Census count and workers the LODES workplace count, each apportioned to this boundary by block area, with anyone who both lives and works inside the line counted once. It is not a count of observed pedestrian activity. 325 of the 423 census blocks this boundary meets lie wholly inside it.
PUBLIC DATAHALL CAPITAL ADVISORY DERIVED2020 Decennial Census P1_001N and LEHD LODES version 8.
Data status and source confidence
BOUNDARY STANDARDIZEDNOT CLASS A CERTIFIEDNot Class A certified. 3 of six gates passed. No composite is shown: the controlled composite is withheld. How the six gates work.
Sources. Tenure and turnover: City of Seattle Active Business License Tax Certificate. Ownership: King County Assessor eReal Property, one detail page per parcel, joined to the county GIS parcel layer for the use and the site address. Residents and workers: 2020 Decennial Census P1_001N and LEHD LODES version 8.
| Gate | Requirement | Disposition | Ledger code |
|---|---|---|---|
| G1 | Official district geometry | Passed | VERIFIED_PASS |
| G2 | Broad establishment universe | Passed | VERIFIED_PASS |
| G3 | Valid start history | Passed | VERIFIED_PASS |
| G4 | Valid trailing 48-month exit history | Refused on measurement: external field required | REFUSED_ON_MEASUREMENT_EXTERNAL_FIELD_REQUIRED |
| G5 | Standardized ownership | Source unavailable | BLOCKED_SOURCE_UNAVAILABLE |
| G6 | Harmonized context | Refused on measurement: superseded published footprint | REFUSED_ON_MEASUREMENT_SUPERSEDED_PUBLISHED_FOOTPRINT |
Read on Central Business District, 522 acres, rung 1, adopted downtown zoning district or overlay. Adopted under Tampa Code sec. 44.20.
What this record means for a decision
Durability is tested in the Acquisition District Screen; who can act, in the District Capital Plan and the Ground-Floor Strategy.
HALL CAPITAL ADVISORY FINDINGHALL CAPITAL ADVISORY THRESHOLDAn interpretation of the bands below, not a score, a rank or advice.
Median years businesses have traded inside this boundary.
5.65 yearsTHINprovisionalThe median across 51 businesses trading inside the line.Openings + closures per 100 starting businesses over four years.
WITHHELDNo register carrying a closing date covers this district.Ownership concentration: share of commercial accounts held by the largest private owner group.
10.15%A POSITIONprovisional266 commercial accounts resolving to 123 owner groups.Structural context · No band or score
Structural presence mix
Baseline Presence is the structural context the three readings are read against. It carries no band and no score. Residents are the 2020 Census count and workers the LODES workplace count, each apportioned to this boundary by block area, with anyone who both lives and works inside the line counted once. It is not a count of observed pedestrian activity. 172 of the 220 census blocks this boundary meets lie wholly inside it.
PUBLIC DATAHALL CAPITAL ADVISORY DERIVED2020 Decennial Census P1_001N and LEHD LODES version 8.
Data status and source confidence
BOUNDARY STANDARDIZEDNOT CLASS A CERTIFIEDNot Class A certified. 0 of six gates passed. No composite is shown: the controlled composite is withheld. How the six gates work.
Sources. Tenure and turnover: Florida DBPR Division of Alcoholic Beverages and Tobacco master licensee file (bd400lic). Ownership: Florida Statewide Cadastral, FGIO and FDOR, county 39. Residents and workers: 2020 Decennial Census P1_001N and LEHD LODES version 8.
| Gate | Requirement | Disposition | Ledger code |
|---|---|---|---|
| G1 | Official district geometry | Refused on measurement: boundary control conflict | REFUSED_ON_MEASUREMENT_BOUNDARY_CONTROL_CONFLICT |
| G2 | Broad establishment universe | Refused on measurement: g1 dependency unresolved | REFUSED_ON_MEASUREMENT_G1_DEPENDENCY_UNRESOLVED |
| G3 | Valid start history | Refused on measurement: g1 dependency unresolved | REFUSED_ON_MEASUREMENT_G1_DEPENDENCY_UNRESOLVED |
| G4 | Valid trailing 48-month exit history | Refused on measurement: g1 dependency unresolved | REFUSED_ON_MEASUREMENT_G1_DEPENDENCY_UNRESOLVED |
| G5 | Standardized ownership | Refused on measurement: g1 dependency unresolved | REFUSED_ON_MEASUREMENT_G1_DEPENDENCY_UNRESOLVED |
| G6 | Harmonized context | Refused on measurement: g1 dependency unresolved | REFUSED_ON_MEASUREMENT_G1_DEPENDENCY_UNRESOLVED |
Read on CA Central Area zoning district, 260 acres, rung 1, adopted downtown zoning district or overlay. Adopted under Temple Central Area base zoning district; per-parcel ordinances carried in the data.
What this record means for a decision
Durability is tested in the Acquisition District Screen; who can act, in the District Capital Plan and the Ground-Floor Strategy.
HALL CAPITAL ADVISORY FINDINGHALL CAPITAL ADVISORY THRESHOLDAn interpretation of the bands below, not a score, a rank or advice.
Median years businesses have traded inside this boundary.
WITHHELD3 dated businesses sit inside this boundary, under the floor of 25. The reading is withheld rather than banded on that few.Openings + closures per 100 starting businesses over four years.
WITHHELD3 ground-floor businesses stood inside this boundary at the start of the window, under the floor of 40. The reading is withheld rather than banded on that few.Ownership concentration: share of commercial accounts held by the largest private owner group.
5.37%NO STANDINGprovisional242 commercial accounts resolving to 127 owner groups.Structural context · No band or score
Structural presence mix
Baseline Presence is the structural context the three readings are read against. It carries no band and no score. Residents are the 2020 Census count and workers the LODES workplace count, each apportioned to this boundary by block area, with anyone who both lives and works inside the line counted once. It is not a count of observed pedestrian activity. 61 of the 106 census blocks this boundary meets lie wholly inside it.
PUBLIC DATAHALL CAPITAL ADVISORY DERIVED2020 Decennial Census P1_001N and LEHD LODES version 8.
Data status and source confidence
BOUNDARY STANDARDIZEDNOT CLASS A CERTIFIEDNot Class A certified. 5 of six gates passed. No composite is shown: the controlled composite is withheld. How the six gates work.
Sources. Tenure and turnover: Texas Alcoholic Beverage Commission licenses and Texas Comptroller sales tax permits, joined to the parcel address. Ownership: StratMap 2025, TxGIO, Bell 48027. Residents and workers: 2020 Decennial Census P1_001N and LEHD LODES version 8.
On the boundary itself The host path is /portal/. Two sibling layers silently drop geometry. Temple's council has recently extended this district, so the boundary moves.
| Gate | Requirement | Disposition | Ledger code |
|---|---|---|---|
| G1 | Official district geometry | Passed | VERIFIED_PASS |
| G2 | Broad establishment universe | Passed | VERIFIED_PASS |
| G3 | Valid start history | Passed | VERIFIED_PASS |
| G4 | Valid trailing 48-month exit history | Passed | VERIFIED_PASS |
| G5 | Standardized ownership | Refused on measurement: roll coverage incomplete | REFUSED_ON_MEASUREMENT_ROLL_COVERAGE_INCOMPLETE |
| G6 | Harmonized context | Passed | VERIFIED_PASS |
Read on Downtown Core Sub-District, Downtown Area Infill Incentive District, 417 acres, rung 1, adopted downtown zoning district or overlay. Adopted under Tucson Unified Development Code Art. 5 sec. 5.12.10.
What this record means for a decision
Durability is tested in the Acquisition District Screen; who can act, in the District Capital Plan and the Ground-Floor Strategy.
HALL CAPITAL ADVISORY FINDINGHALL CAPITAL ADVISORY THRESHOLDAn interpretation of the bands below, not a score, a rank or advice.
Median years businesses have traded inside this boundary.
5.52 yearsTHINThe median across 530 businesses trading inside the line.Openings + closures per 100 starting businesses over four years.
WITHHELDNo register carrying a closing date covers this district.Ownership concentration: share of commercial accounts held by the largest private owner group.
4.86%NO STANDINGprovisional144 commercial accounts resolving to 86 owner groups.Structural context · No band or score
Structural presence mix
Baseline Presence is the structural context the three readings are read against. It carries no band and no score. Residents are the 2020 Census count and workers the LODES workplace count, each apportioned to this boundary by block area, with anyone who both lives and works inside the line counted once. It is not a count of observed pedestrian activity. 45 of the 107 census blocks this boundary meets lie wholly inside it.
PUBLIC DATAHALL CAPITAL ADVISORY DERIVED2020 Decennial Census P1_001N and LEHD LODES version 8.
Data status and source confidence
BOUNDARY STANDARDIZEDNOT CLASS A CERTIFIEDNot Class A certified. 3 of six gates passed. No composite is shown: the controlled composite is withheld. How the six gates work.
Sources. Tenure and turnover: City of Tucson business licenses. Ownership: Pima County Assessor roll via the City of Tucson. Residents and workers: 2020 Decennial Census P1_001N and LEHD LODES version 8.
| Gate | Requirement | Disposition | Ledger code |
|---|---|---|---|
| G1 | Official district geometry | Passed | VERIFIED_PASS |
| G2 | Broad establishment universe | Passed | VERIFIED_PASS |
| G3 | Valid start history | Passed | VERIFIED_PASS |
| G4 | Valid trailing 48-month exit history | Refused on measurement: external field required | REFUSED_ON_MEASUREMENT_EXTERNAL_FIELD_REQUIRED |
| G5 | Standardized ownership | Refused on measurement: superseded published footprint | REFUSED_ON_MEASUREMENT_SUPERSEDED_PUBLISHED_FOOTPRINT |
| G6 | Harmonized context | Refused on measurement: superseded published footprint | REFUSED_ON_MEASUREMENT_SUPERSEDED_PUBLISHED_FOOTPRINT |
Read on DBAC Downtown Business, Arts and Culture zoning, 193 acres, rung 1, adopted downtown zoning district or overlay. Adopted under Per-case rezoning ordinances carried in the data, 1999 to 2026.
What this record means for a decision
Durability is tested in the Acquisition District Screen; who can act, in the District Capital Plan and the Ground-Floor Strategy.
HALL CAPITAL ADVISORY FINDINGHALL CAPITAL ADVISORY THRESHOLDAn interpretation of the bands below, not a score, a rank or advice.
Median years businesses have traded inside this boundary.
6.10 yearsSETTLINGThe median across 136 businesses trading inside the line.Openings + closures per 100 starting businesses over four years.
113.7 per 100CHURNING76 opened and 57 closed against 117 ground-floor businesses at the start of the window.Ownership concentration: share of commercial accounts held by the largest private owner group.
3.64%NO STANDING397 commercial accounts resolving to 204 owner groups.Structural context · No band or score
Structural presence mix
Baseline Presence is the structural context the three readings are read against. It carries no band and no score. Residents are the 2020 Census count and workers the LODES workplace count, each apportioned to this boundary by block area, with anyone who both lives and works inside the line counted once. It is not a count of observed pedestrian activity. 37 of the 100 census blocks this boundary meets lie wholly inside it.
PUBLIC DATAHALL CAPITAL ADVISORY DERIVED2020 Decennial Census P1_001N and LEHD LODES version 8.
Data status and source confidence
BOUNDARY DISPLAYED — PROVENANCE MIGRATION PENDINGCLASS A CERTIFIEDHolds the governed Class A certification and passes all six gates. No composite is shown: the controlled composite is withheld. How the six gates work.
Sources. Tenure and turnover: Texas Alcoholic Beverage Commission licenses and Texas Comptroller sales tax permits, joined to the parcel address. Ownership: StratMap 48423 for owner, mailing street and situs; Smith County parcel layer for the commercial class. Residents and workers: 2020 Decennial Census P1_001N and LEHD LODES version 8.
On the boundary itself Read from the Esri-hosted copy. The city's own GIS host publishes a robots.txt naming our agent with Disallow: /. The Downtown Planning Area 2024 is 531 acres, 2.8 times the zoning district, and carries no adopting ordinance.
| Gate | Requirement | Disposition | Ledger code |
|---|---|---|---|
| G1 | Official district geometry | Passed | VERIFIED_PASS |
| G2 | Broad establishment universe | Passed | VERIFIED_PASS |
| G3 | Valid start history | Passed | VERIFIED_PASS |
| G4 | Valid trailing 48-month exit history | Passed | VERIFIED_PASS |
| G5 | Standardized ownership | Passed | VERIFIED_PASS |
| G6 | Harmonized context | Passed | VERIFIED_PASS |
Read on Downtown Overlay District, 246 acres, rung 1, adopted downtown zoning district or overlay. Adopted under Waco Code chapter 28, article IV, division 28, Special Districts Overlay.
What this record means for a decision
Durability is tested in the Acquisition District Screen; who can act, in the District Capital Plan and the Ground-Floor Strategy.
HALL CAPITAL ADVISORY FINDINGHALL CAPITAL ADVISORY THRESHOLDAn interpretation of the bands below, not a score, a rank or advice.
Median years businesses have traded inside this boundary.
5.48 yearsTHINThe median across 298 businesses trading inside the line.Openings + closures per 100 starting businesses over four years.
110.9 per 100CHURNING165 opened and 161 closed against 294 ground-floor businesses at the start of the window.Ownership concentration: share of commercial accounts held by the largest private owner group.
5.42%NO STANDING298 commercial accounts resolving to 155 owner groups.Structural context · No band or score
Structural presence mix
Baseline Presence is the structural context the three readings are read against. It carries no band and no score. Residents are the 2020 Census count and workers the LODES workplace count, each apportioned to this boundary by block area, with anyone who both lives and works inside the line counted once. It is not a count of observed pedestrian activity. 24 of the 85 census blocks this boundary meets lie wholly inside it.
PUBLIC DATAHALL CAPITAL ADVISORY DERIVED2020 Decennial Census P1_001N and LEHD LODES version 8.
Data status and source confidence
BOUNDARY DISPLAYED — PROVENANCE MIGRATION PENDINGCLASS A CERTIFIEDHolds the governed Class A certification and passes all six gates. No composite is shown: the controlled composite is withheld. How the six gates work.
Sources. Tenure and turnover: Texas Alcoholic Beverage Commission licenses and Texas Comptroller sales tax permits, joined to the parcel address. Ownership: McLennan CAD attributes republished by the City of Waco. Residents and workers: 2020 Decennial Census P1_001N and LEHD LODES version 8.
On the boundary itself This overturns the earlier finding that Waco publishes no declared boundary. It does. The C-4 Central Commercial zoning district is 220 acres against 246 for the overlay, an 11 percent difference between two independent instruments, which is a good consistency check. The 2,389-acre riverfront TIF that was rejected earlier is stored as nine named sub-polygons, one of which is explicitly the central business district.
| Gate | Requirement | Disposition | Ledger code |
|---|---|---|---|
| G1 | Official district geometry | Passed | VERIFIED_PASS |
| G2 | Broad establishment universe | Passed | VERIFIED_PASS |
| G3 | Valid start history | Passed | VERIFIED_PASS |
| G4 | Valid trailing 48-month exit history | Passed | VERIFIED_PASS |
| G5 | Standardized ownership | Passed | VERIFIED_PASS |
| G6 | Harmonized context | Passed | VERIFIED_PASS |
Read on Downtown DC BID, 635 acres, rung 3, downtown-purposed special district. Adopted under DC Code 2-1215, BID Act of 1996.
What this record means for a decision
Durability is tested in the Acquisition District Screen; who can act, in the District Capital Plan and the Ground-Floor Strategy.
HALL CAPITAL ADVISORY FINDINGHALL CAPITAL ADVISORY THRESHOLDAn interpretation of the bands below, not a score, a rank or advice.
Median years businesses have traded inside this boundary.
4.55 yearsTHINThe median across 2,237 businesses trading inside the line.Openings + closures per 100 starting businesses over four years.
67.4 per 100CYCLING1,300 opened and 1,224 closed against 3,746 ground-floor businesses at the start of the window.Ownership concentration: share of commercial accounts held by the largest private owner group.
5.86%NO STANDING563 commercial accounts resolving to 340 owner groups.Structural context · No band or score
Structural presence mix
Baseline Presence is the structural context the three readings are read against. It carries no band and no score. Residents are the 2020 Census count and workers the LODES workplace count, each apportioned to this boundary by block area, with anyone who both lives and works inside the line counted once. It is not a count of observed pedestrian activity. 118 of the 180 census blocks this boundary meets lie wholly inside it.
PUBLIC DATAHALL CAPITAL ADVISORY DERIVED2020 Decennial Census P1_001N and LEHD LODES version 8.
Data status and source confidence
BOUNDARY STANDARDIZEDNOT CLASS A CERTIFIEDPasses all six gates and is not Class A certified. Six passed gates is not certification. No composite is shown: the controlled composite is withheld. How the six gates work.
Sources. Tenure and turnover: DC DLCP Basic Business Licenses. Ownership: DC OTR Integrated Tax System Public Extract. Residents and workers: 2020 Decennial Census P1_001N and LEHD LODES version 8.
| Gate | Requirement | Disposition | Ledger code |
|---|---|---|---|
| G1 | Official district geometry | Passed | VERIFIED_PASS |
| G2 | Broad establishment universe | Passed | VERIFIED_PASS |
| G3 | Valid start history | Passed | VERIFIED_PASS |
| G4 | Valid trailing 48-month exit history | Passed | VERIFIED_PASS |
| G5 | Standardized ownership | Passed | VERIFIED_PASS |
| G6 | Harmonized context | Passed | VERIFIED_PASS |
Read on CBD, the core of the Greater Downtown Zoning District, 227 acres, rung 1, adopted downtown zoning district or overlay. Adopted under Wichita Falls zoning ordinance section 3800, Ordinance 30-2022 adopted 16 August 2022.
What this record means for a decision
Durability is tested in the Acquisition District Screen; who can act, in the District Capital Plan and the Ground-Floor Strategy.
HALL CAPITAL ADVISORY FINDINGHALL CAPITAL ADVISORY THRESHOLDAn interpretation of the bands below, not a score, a rank or advice.
Median years businesses have traded inside this boundary.
WITHHELD17 dated businesses sit inside this boundary, under the floor of 25. The reading is withheld rather than banded on that few.Openings + closures per 100 starting businesses over four years.
WITHHELD28 ground-floor businesses stood inside this boundary at the start of the window, under the floor of 40. The reading is withheld rather than banded on that few.Ownership concentration: share of commercial accounts held by the largest private owner group.
3.50%NO STANDING314 commercial accounts resolving to 174 owner groups.Structural context · No band or score
Structural presence mix
Baseline Presence is the structural context the three readings are read against. It carries no band and no score. Residents are the 2020 Census count and workers the LODES workplace count, each apportioned to this boundary by block area, with anyone who both lives and works inside the line counted once. It is not a count of observed pedestrian activity. 39 of the 78 census blocks this boundary meets lie wholly inside it.
PUBLIC DATAHALL CAPITAL ADVISORY DERIVED2020 Decennial Census P1_001N and LEHD LODES version 8.
Data status and source confidence
BOUNDARY STANDARDIZEDNOT CLASS A CERTIFIEDPasses all six gates and is not Class A certified. Six passed gates is not certification. No composite is shown: the controlled composite is withheld. How the six gates work.
Sources. Tenure and turnover: Texas Alcoholic Beverage Commission licenses and Texas Comptroller sales tax permits, joined to the parcel address. Ownership: Wichita AD appraisal export, state-code lookup and parcel shapefile. Residents and workers: 2020 Decennial Census P1_001N and LEHD LODES version 8.
On the boundary itself The Greater Downtown Zoning District is four districts totalling 555 acres, of which CBD is the central business core. The host returns 403 or 502 on where clauses using IN, LIKE or chained ORs, so each district must be fetched separately. The service name is misspelled Plainning.
| Gate | Requirement | Disposition | Ledger code |
|---|---|---|---|
| G1 | Official district geometry | Passed | VERIFIED_PASS |
| G2 | Broad establishment universe | Passed | VERIFIED_PASS |
| G3 | Valid start history | Passed | VERIFIED_PASS |
| G4 | Valid trailing 48-month exit history | Passed | VERIFIED_PASS |
| G5 | Standardized ownership | Passed | VERIFIED_PASS |
| G6 | Harmonized context | Passed | VERIFIED_PASS |
FILLED OUTLINEDprovisional A band is filled when every gate governing that reading has passed in the ledger, and outlined when one has not. The value does not change; what is provisional is the comparison across districts. 112 of the 153 bands published here are filled.
Each downtown is one dot, and the selected district is marked. A district appears on a scale when its boundary carries enough records to support that reading. Tenure is drawn for 41 of the 83, turnover for 34 and ownership for 78.
Each dot is one downtown, read inside the boundary that city adopted for its own downtown. The colored bar under each of the first three scales is the band the reading falls in. The red line is the level at which the reading changes what a principal should assume. The fourth scale carries no bands, because no cut on district population has been earned yet. Nothing is hidden behind a hover.
Drawn for 41 of the 83 districts. A district is drawn here when at least twenty-five dated businesses sit inside its boundary. The rest are carried in the index with this reading withheld rather than banded on a handful of records. At six years the roster has survived one commercial lease cycle. Below it, every business on the street is inside its first lease.
Drawn for 34 of the 83 districts, the ones carrying at least forty ground-floor businesses at the start of the four-year window. At seventy per hundred the street is remaking itself faster than a lease cycle replaces it, and that cost sits in nobody's rent roll. Turnover is a rate, not a driver, and it contributes no points to the District Premium Score.
Drawn for 78 of the 83 districts, the ones carrying at least forty commercial accounts after entity resolution. Eight percent is the floor. Below it no owner holds enough neighboring property to price a traffic-making tenant below market and recover the cost from the neighbors who benefit.
Drawn for all 83 districts, because this reading comes from two national files rather than from eighty local ones and every boundary can be read on it. The axis is logarithmic: the densest district in the index carries more than a hundred times the people per acre the thinnest does. On an even axis two thirds of the field would sit in the first inch. The dashed line is the median district, which describes the field. It is not a cut, and no band is drawn, because a larger population is not by itself a better district.
Research views
Observations, not findings. Nothing here is banded or scored and no line is fitted.
PUBLIC DATAHALL CAPITAL ADVISORY DERIVEDDrawn only for districts clearing the record floor on the reading in question. The dashed line on each panel is a Hall Capital Advisory threshold.
The three readings and the population base for every district, sortable on any column.
| District | Tenure, years | Turnover, per 100 | Largest holder | Presence per acre | Presence mix |
|---|---|---|---|---|---|
| AbileneCB Central Business zoning district | withheld, too few records | withheld, too few records | 4.20%NO STANDING | 16 | Residents 12% |
| AlbuquerqueMX-FB-UD form based urban development district | 9.1SETTLING | withheld, too few records | 6.55%NO STANDING | 66 | Residents 6% |
| AllenDowntown District | withheld, too few records | withheld, too few records | 18.47%APPROACHING | 8 | Residents 14% |
| AmarilloTIRZ Center City Zone 1 | withheld, too few records | withheld, too few records | 3.86%NO STANDING | 13 | Residents 16% |
| ArlingtonDB Downtown Business zoning | withheld, too few records | withheld, too few records | 9.40%A POSITION | 26 | Residents 16% |
| AustinDowntown Austin Plan Districts | 5.8THIN | 103.7CHURNING | 4.55%NO STANDING | 134 | Residents 9% |
| BaltimoreC-5 Downtown District | 7.5SETTLING | 72.5REPLACING | 6.55%NO STANDING | 112 | Residents 13% |
| BaytownDowntown Arts, Main Street and Flex zoning | withheld, too few records | withheld, too few records | 6.49%NO STANDING | 7 | Residents 50% |
| BeaumontCBD Central Business District zoning | withheld, too few records | withheld, too few records | 20.41%THE THRESHOLD | 24 | Residents 8% |
| BostonPLAN: Downtown | 10.8SETTLING | 46.2HELD | 11.91%NO STANDING | 628 | Residents 11% |
| BrownsvilleDowntown Core, Edge and General zoning | 4.0THIN | 83.6CHURNING | 4.68%NO STANDING | 23 | Residents 44% |
| BryanDT-C, DT-N and DT-S downtown zoning | withheld, too few records | withheld, too few records | 5.59%NO STANDING | 26 | Residents 9% |
| CarrolltonDTC Downtown Transit Center zoning | 6.0THIN | withheld, too few records | 4.08%NO STANDING | 21 | Residents 41% |
| CharlotteCenter City Municipal Service District, MSD 3 | 8.0SETTLING | withheld, too few records | 3.94%A POSITION | 433 | Residents 4% |
| ChicagoDowntown districts DC, DX, DR, DS | 7.1SETTLING | 102.5CHURNING | 6.48%NO STANDING | 299 | Residents 15% |
| College StationNG-1, NG-2 and NG-3 Northgate zoning | withheld, too few records | withheld, too few records | 10.14%A POSITION | 47 | Residents 86% |
| ColumbusDowntown District | withheld, too few records | withheld, too few records | 4.28%NO STANDING | 66 | Residents 10% |
| ConroeDowntown, Code section 14-601 | withheld, too few records | withheld, too few records | 2.91%NO STANDING | 10 | Residents 37% |
| Corpus ChristiReinvestment Zone Number 3, Downtown | 5.6THIN | 58.5CYCLING | 4.11%NO STANDING | 14 | Residents 14% |
| DallasDowntown Improvement District | 4.9THIN | 125.2CHURNING | 3.79%NO STANDING | 124 | Residents 8% |
| DentonDowntown Implementation Plan boundary | 4.2THIN | 78.3REPLACING | 5.08%NO STANDING | 22 | Residents 18% |
| DenverDowntown neighborhood context zone districts | 12.3SETTLING | 37.2HELD | 1.36%NO STANDING | 156 | Residents 11% |
| DetroitCentral Business District per the zoning ordinance | withheld, too few records | withheld, too few records | 4.57%NO STANDING | 82 | Residents 8% |
| EdinburgDT Downtown zoning district | 8.4SETTLING | 108.2CHURNING | 2.44%NO STANDING | 38 | Residents 5% |
| El PasoEl Paso Downtown Management District | 7.1SETTLING | 104.5CHURNING | 5.01%NO STANDING | 42 | Residents 12% |
| Fort WorthH Central Business zoning district | 4.7THIN | 69.6CYCLING | 7.13%NO STANDING | 73 | Residents 16% |
| FresnoDowntown Core, General and Neighborhood districts | withheld, too few records | withheld, too few records | withheld, too few records | 42 | Residents 15% |
| FriscoThe Rail District | withheld, too few records | withheld, too few records | 2.78%NO STANDING | 15 | Residents 24% |
| GarlandDT downtown zoning | withheld, too few records | withheld, too few records | 5.36%NO STANDING | 10 | Residents 32% |
| GeorgetownDowntown Overlay District | 5.6THIN | 56.6CYCLING | 5.17%NO STANDING | 44 | Residents 10% |
| Grand PrairieCentral Business District, four sub-districts | 5.0THIN | 62.7CYCLING | 1.89%NO STANDING | 5 | Residents 51% |
| HartfordDT-1, DT-2 and DT-3 Downtown districts | 6.8SETTLING | 107.4CHURNING | 10.53%A POSITION | 128 | Residents 9% |
| HoustonHouston Downtown Management District | 6.2SETTLING | 56.0CYCLING | 3.46%NO STANDING | 147 | Residents 10% |
| IndianapolisRegional Center | withheld, too few records | withheld, too few records | 7.80%NO STANDING | 42 | Residents 15% |
| IrvingDowntown Development District overlay | withheld, too few records | withheld, too few records | 6.54%NO STANDING | 12 | Residents 47% |
| JacksonvilleDowntown Overlay Zone | 5.7THIN | withheld, too few records | 9.38%A POSITION | 29 | Residents 12% |
| Kansas CityDowntown KC Community Improvement District | withheld, too few records | withheld, too few records | 34.20%NO STANDING | 87 | Residents 22% |
| KilleenHistorical Downtown overlay | withheld, too few records | withheld, too few records | 5.81%NO STANDING | 22 | Residents 6% |
| LaredoCBD zoning district | withheld, too few records | 87.5CHURNING | 5.08%NO STANDING | 28 | Residents 20% |
| Las VegasDowntown Las Vegas Overlay District | 5.6THIN | 135.3CHURNING | 4.54%NO STANDING | 29 | Residents 23% |
| League CityOlde Towne and Olde Towne Transition zoning | withheld, too few records | withheld, too few records | 5.66%NO STANDING | 12 | Residents 25% |
| LewisvilleOld Town Design District | withheld, too few records | withheld, too few records | 2.08%NO STANDING | 13 | Residents 40% |
| LongviewCentral Business zoning district | withheld, too few records | withheld, too few records | 11.28%A POSITION | 17 | Residents 19% |
| Los AngelesDowntown Community Plan Implementation Overlay | 12.7SETTLING | 27.2HELD | withheld, too few records | 135 | Residents 21% |
| LouisvilleDowntown Development Review Overlay | withheld, too few records | withheld, too few records | withheld, too few records | 90 | Residents 8% |
| LubbockCentral Business District TIF | withheld, too few records | withheld, too few records | 7.72%NO STANDING | 20 | Residents 13% |
| McAllenCC-DT City Core Downtown zoning | 2.4THIN | 93.6CHURNING | 2.37%NO STANDING | 29 | Residents 12% |
| McKinneyMTC McKinney Town Center zoning | 5.3THIN | 61.3CYCLING | 3.62%NO STANDING | 19 | Residents 22% |
| MemphisCentral Business Improvement District | withheld, too few records | withheld, too few records | 2.18%NO STANDING | 23 | Residents 25% |
| MesaDowntown Mesa zoning districts | withheld, too few records | withheld, too few records | 2.46%NO STANDING | 28 | Residents 21% |
| MesquiteDowntown Main Street Program Area | withheld, too few records | withheld, too few records | 4.40%NO STANDING | 6 | Residents 4% |
| MiamiMiami Downtown Development Authority | 7.6SETTLING | 50.6CYCLING | 4.86%NO STANDING | 183 | Residents 25% |
| MidlandDowntown Midland Management District | 5.7THIN | 73.5REPLACING | 7.09%NO STANDING | 55 | Residents 1% |
| MilwaukeeDowntown districts C9A to C9H | withheld, too few records | withheld, too few records | 2.78%NO STANDING | 91 | Residents 18% |
| MinneapolisDowntown Center and Downtown Destination districts | withheld, too few records | withheld, too few records | 7.21%NO STANDING | 126 | Residents 16% |
| NashvilleDowntown Code district | withheld, too few records | withheld, too few records | 2.64%NO STANDING | 59 | Residents 13% |
| New BraunfelsMain Street District | withheld, too few records | withheld, too few records | 3.65%NO STANDING | 15 | Residents 12% |
| New York CitySpecial Lower Manhattan District | 6.5SETTLING | 66.8CYCLING | 0.88%NO STANDING | 634 | Residents 15% |
| OdessaDowntown Overlay Zone | withheld, too few records | withheld, too few records | 9.70%A POSITION | 24 | Residents 8% |
| Oklahoma CityDowntown Design Districts | withheld, too few records | withheld, too few records | 8.36%A POSITION | 31 | Residents 15% |
| OrlandoDowntown Development Board area | 7.4SETTLING | 113.3CHURNING | 8.11%A POSITION | 92 | Residents 14% |
| PearlandOld Townsite zoning districts | 4.9THIN | 100.0CHURNING | 5.13%NO STANDING | 8 | Residents 66% |
| PharrMain Street district parcels | withheld, too few records | withheld, too few records | 5.04%NO STANDING | 19 | Residents 13% |
| PhiladelphiaCenter City District | 13.8SETTLING | 36.4HELD | 2.07%NO STANDING | 413 | Residents 12% |
| PlanoBG Downtown Business/Government zoning | withheld, too few records | withheld, too few records | 3.76%NO STANDING | 30 | Residents 32% |
| Portland ORCentral City Plan District | withheld, too few records | withheld, too few records | 1.37%NO STANDING | 58 | Residents 25% |
| RaleighDowntown Mixed Use districts | 3.6THIN | withheld, too few records | 4.56%NO STANDING | 81 | Residents 10% |
| RichardsonCORE District, Downtown sub-district | withheld, too few records | withheld, too few records | 8.80%A POSITION | 19 | Residents 12% |
| Round RockDowntown Mixed Use Amendment Area | withheld, too few records | withheld, too few records | 3.23%NO STANDING | 13 | Residents 29% |
| SacramentoC-3 Central Business District zone | 7.3SETTLING | 79.0REPLACING | withheld, too few records | 124 | Residents 8% |
| Salt Lake CityD-1 Central Business District | withheld, too few records | withheld, too few records | 15.78%APPROACHING | 108 | Residents 7% |
| San AntonioCentral Business District | 6.9SETTLING | 92.3CHURNING | 2.73%NO STANDING | 43 | Residents 10% |
| San DiegoCentre City Planned District | 9.3SETTLING | 110.9CHURNING | 2.94%NO STANDING | 98 | Residents 40% |
| San FranciscoC-3 Downtown Commercial Districts | 9.0SETTLING | 66.1CYCLING | withheld, too few records | 609 | Residents 7% |
| San JoseDowntown Primary Commercial districts | withheld, too few records | withheld, too few records | 9.42%A POSITION | 65 | Residents 23% |
| SeattleDowntown zoning designations | 9.4SETTLING | withheld, too few records | 2.06%NO STANDING | 262 | Residents 16% |
| TampaCentral Business District | 5.7THIN | withheld, too few records | 10.15%A POSITION | 147 | Residents 6% |
| TempleCA Central Area zoning district | withheld, too few records | withheld, too few records | 5.37%NO STANDING | 13 | Residents 22% |
| TucsonDowntown Core Sub-District, Downtown Area Infill Incentive District | 5.5THIN | withheld, too few records | 4.86%NO STANDING | 59 | Residents 6% |
| TylerDBAC Downtown Business, Arts and Culture zoning | 6.1SETTLING | 113.7CHURNING | 3.64%NO STANDING | 25 | Residents 28% |
| WacoDowntown Overlay District | 5.5THIN | 110.9CHURNING | 5.42%NO STANDING | 40 | Residents 6% |
| Washington DCDowntown DC BID | 4.5THIN | 67.4CYCLING | 5.86%NO STANDING | 293 | Residents 5% |
| Wichita FallsCBD, the core of the Greater Downtown Zoning District | withheld, too few records | withheld, too few records | 3.50%NO STANDING | 17 | Residents 17% |
Click any column to sort the 83 by that reading. Every column is read inside the boundary the city adopted. A cell saying the reading is withheld means the boundary carries too few records to support it, not that the district was left out.
Rendered from District Index commit f4cef3c of 2026-09-12, payload build website-f4cef3c, methodology 2.0. Every figure here changes when that commit changes.
District map
The map draws the 161 boundary polygons of the 78 districts whose
boundary passes G1 in District Index commit f4cef3c. The key beside the
map says what each color means. Choose a district to see its boundary, certification and gate
count.
Loading the map.
A scenario is yours, not Hall Capital Advisory's. Anything you draw or compare here is a working draft: it stays in this browser tab, it is not uploaded, saved, scored or certified, it changes nothing in the District Index, and it is gone when the page reloads. The adopted boundaries on the map are unchanged by it.
Choose a GeoJSON polygon and it is measured in this browser on the WGS84 authalic sphere, then compared by acreage with the 83 published districts that declare an acreage. Nothing is uploaded to a service, nothing is saved, and the file is not drawn on the map. Against the equal-area projection the Index measures on, the browser measurement agrees to within about three tenths of a percent at district scale.
Third-party map tiles. Street tiles come from the OpenStreetMap Foundation's tile servers and satellite imagery from Esri. Your browser requests those tiles directly, so those services receive your IP address and the area you are viewing. Hall Capital Advisory sends them nothing else, and this map sets no cookies and stores nothing.
Street map © OpenStreetMap contributors. Satellite imagery: Esri, Maxar, Earthstar Geographics, and the GIS User Community.
Rendered with MapLibre GL JS 6.9.0 (BSD-3-Clause), Terra Draw 1.33.0 (MIT), Terra Draw MapLibre GL adapter 1.4.1 (MIT).
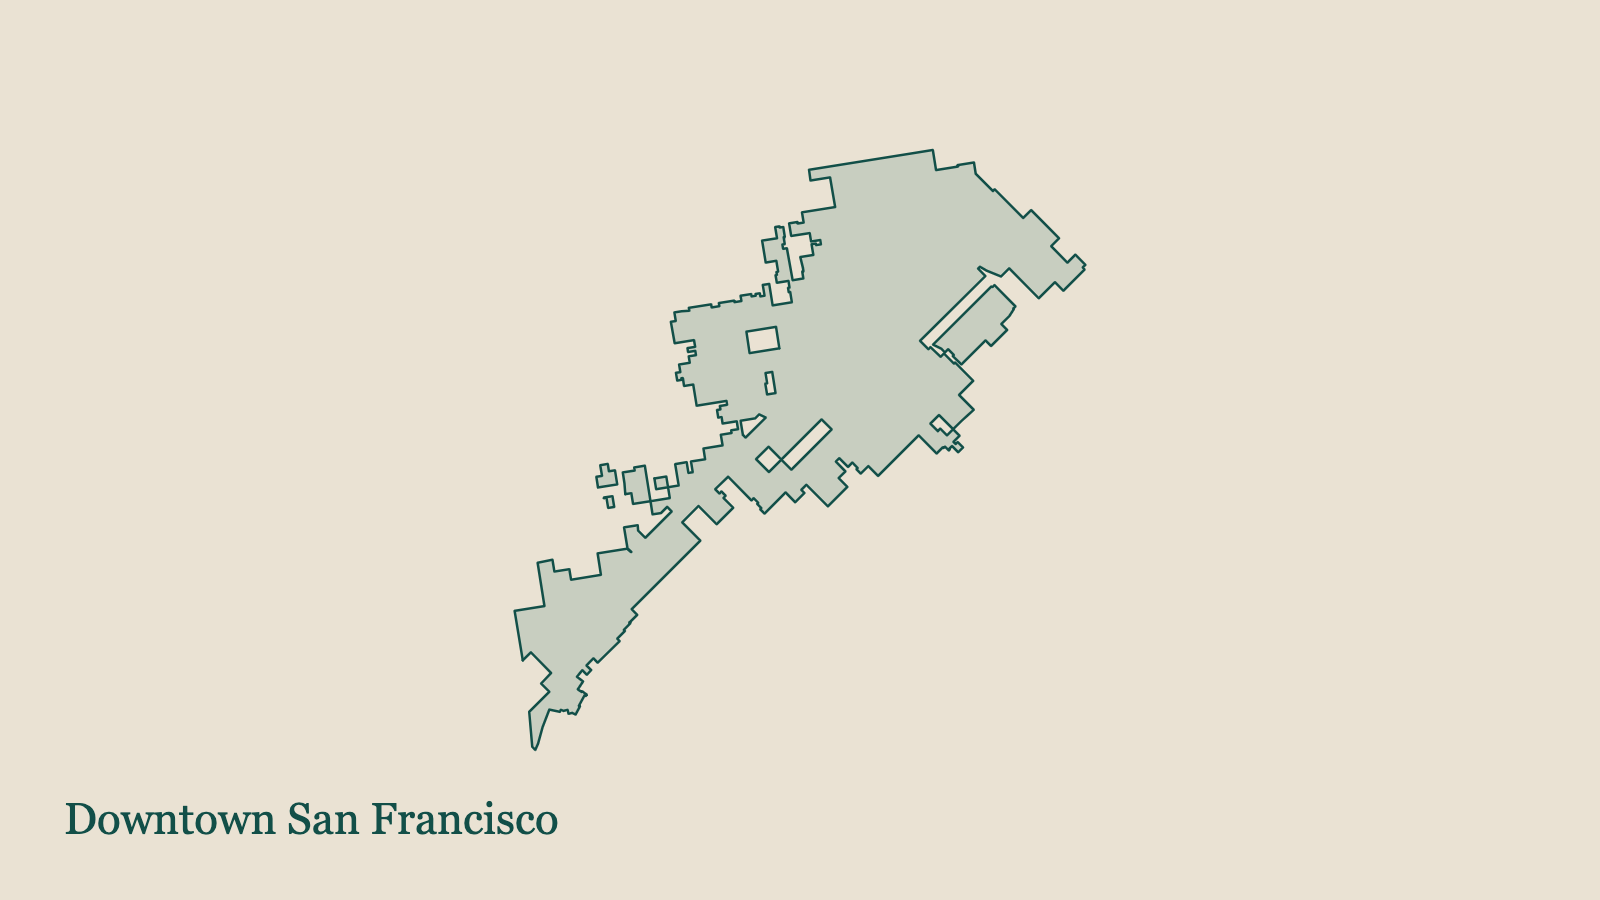
Everything behind the records above, for readers who want to check it.
Background: the mapped adopted downtown boundary of Downtown San Francisco, drawn from the District Index map. It is not a reading or a result.
Three readings are taken inside the boundary each city adopted. A reading below its record floor is withheld rather than banded, and the district stays in the Index with the reading marked.
HALL CAPITAL ADVISORY DERIVEDHALL CAPITAL ADVISORY THRESHOLDEvery cut, floor and gate is Hall Capital Advisory's and every one is published.
The controlled composite is withheld. 3 of the 10 strict peers, Chicago, Edinburg, Pearland, have their certification suspended, and the composite is normalized across the whole strict peer set, so no composite score, rank or component is shown for any district while the suspension stands.
What would restore it. Publication resumes when controls/peer-certification-suspensions.json carries no entry: each suspended peer either recovers its sixth pass on evidence, or Hall Capital Advisory rules it out of the strict peer set. The second of those changes the peer universe, and the composite is then recomputed rather than restored.
The ledger, 498 cells
Structural Footfall Potential is Hall Capital Advisory's proprietary model framework, in development. It is not a calibrated metric, it is not a client output, and no reading from it is published. Status: MODEL IN DEVELOPMENT. Calibration directive: DO NOT CALIBRATE.
78 boundaries pass G1 and are drawn on the map.
Rendered from District Index commit f4cef3c of 2026-09-12, payload build website-f4cef3c, methodology 2.0. Every figure here changes when that commit changes.
HALL CAPITAL ADVISORY DERIVEDHALL CAPITAL ADVISORY THRESHOLDRelease state is read from the District Index release contract and gate ledger. The six gates, the certification rule and the composite method are Hall Capital Advisory's.
Every district is read inside its adopted boundary. Whether a reading is standardized across districts is a separate question, answered gate by gate in the ledger. Each cell carries one permanent disposition: passed, failed its threshold, source unavailable, or refused on measurement with its reason. Passing all six gates does not by itself make a district Class A certified, and a certification badge on this page requires both.
The exact adopted or administratively defined polygon, its authority and its effective date.
A physical business-location population broad enough to represent the district, rather than a licensed or regulated subset.
Actual establishment persistence evidence rather than database ingestion age.
Dated closures, with moves distinguishable from true exits.
One qualifying commercial parcel universe and one owner-normalization method across every district.
Census and one common LODES vintage clipped to the same district polygon.
HALL CAPITAL ADVISORY THRESHOLDThe six gates, their requirements and the certification rule are Hall Capital Advisory's standard. Dispositions are read from the gate ledger.
This tab is generated from one District Index payload and holds no district fact of its own. The payload is checked byte for byte against its manifest before a page is written, and the build refuses if any file differs.
f4cef3c1bb665880afff5f2474c3fddb59fab490, 2026-09-12website-f4cef3c16f49b85c3ba79dde9a8d5d78f49a1e9a216930c087051403ed57c97117ad66eA boundary drawn, uploaded or modified on this tab is a client scenario. It is never Hall Capital Advisory evidence, never enters the gate ledger, and never changes a certification on this page.
Provenance
Every figure on this site carries the class of evidence behind it. The labels sit beside the number rather than under the page, because a reader deciding whether to trust a figure should not have to hunt for what kind of figure it is.
A figure taken directly from a government or public administrative record. Census, LODES, a county roll, a state or municipal register. Free to anyone, and checkable against the same file.
A commercial or licensed source used in an analysis. Named, with its vintage, so a reader knows which part of a reading they cannot reproduce without the same license.
Published academic, industry or agency evidence the firm is citing rather than producing. The source and the table are named.
A calculation the firm produces from source observations. A rate, a share, a median, a concentration. The inputs are public; the arithmetic is the firm's.
An interpretation produced by the firm's research: what the numbers mean for a decision, stated plainly enough that a reader can dispute it.
A proprietary cut, weight, gate or scoring rule. This is where the firm made a choice. Move the cut and the band changes, which is why every cut on this site is printed.
A Hall Capital Advisory model whose purpose, variables and validation sequence are published and whose coefficients are not yet estimated against observed activity. It marks a method, never a number. No reading is published under it.
An estimate produced by a calibrated model rather than a directly observed count. A model earns this label after calibration, holdout testing and a published error. Nothing on this site carries it yet, and the Index says what would have to happen first.
The last two labels are the ones to watch. A finding is an interpretation the firm will defend. A threshold is a cut the firm chose, and every cut on this site is printed so a reader can move it and see what happens.
MODEL IN DEVELOPMENT · DO NOT CALIBRATE
MODEL IN DEVELOPMENTEXTERNAL BENCHMARKThe model framework is Hall Capital Advisory's and its methodology is published. No reading is.
Structural Footfall Potential is Hall Capital Advisory's proprietary model framework, in development. It is not a calibrated metric, it is not a client output, and no reading from it is published.
The obvious next step from a population base is a projected footfall. The conversion from residents and workers to pedestrian volume depends on land-use mix, street connectivity, transit, trip purpose and time of day, and published tests of transferring a fitted pedestrian model to a new place find errors of the same order as the counts themselves. The model has to be calibrated against observed counts, held out on districts it was not fitted on, and reported with its error before any number from it is published.
Until then this tab publishes no Structural Footfall Potential score, no projected visitation, no pedestrian footfall estimate and no Attraction Lift, and nothing drawn or uploaded here is scored by it. Residents and workers are shown as district context, never as observed footfall.
The metric stack
Population says who is structurally present. Structural Footfall Potential would estimate how much pedestrian activity that population should support. Observed footfall would measure what actually happens. Attraction Lift would say whether the district performs above or below that expectation. Baseline Presence and its density are published. Structural Footfall Potential has a published methodology and no reading. Attraction Lift waits on both. Each says what it would require.
The resident and worker population structurally associated with the official district geography.
Residents plus workers, with resident-worker overlap removed where the origin and destination file supports it.
Not observed footfall, and not a fourth District Index reading.
PUBLIC DATAHALL CAPITAL ADVISORY DERIVED
Baseline Presence divided by district acres.
The measure that makes a 60 acre district and a 1,600 acre district comparable.
Contextual. It carries no band and no score, and it is outside the Index composite.
PUBLIC DATAHALL CAPITAL ADVISORY DERIVED
Estimates the pedestrian activity a district's structural population should support after accounting for density, resident and worker composition, land-use mix, connectivity, transit access and destination intensity.
Resident circulation, plus worker circulation, plus a structural attraction adjustment. Candidate inputs include the resident and worker balance, presence density, land-use diversity, ground-floor destination density, pedestrian connectivity, transit accessibility, internal trip capture, visitor anchors, district type and daypart.
The methodology is Hall Capital Advisory's and it is published. The coefficients are not estimated yet. The firm is calibrating the model against observed district activity, and no reading is published until validation is complete. Choosing weights by judgment and printing the result would be a score, not a measure.
MODEL IN DEVELOPMENTHALL CAPITAL ADVISORY THRESHOLD
Observed street activity relative to the structural population base.
Observed footfall divided by Baseline Presence.
Requires an observed count. The provenance of that count travels with the measure.
HALL CAPITAL ADVISORY DERIVED
Whether actual district activity exceeds or falls short of the modelled expectation.
Observed footfall divided by Structural Footfall Potential. Above 1.00 is more activity than the structure predicts; below 1.00 is less.
Its denominator is Structural Footfall Potential, so it cannot become operational before that model is calibrated. A ratio over an uncalibrated denominator reports a precision neither side of it has. Never displayed without naming both the modelled denominator and the observed numerator, and never characterized as good or bad without the district type, the time period and the three Index readings beside it.
HALL CAPITAL ADVISORY DERIVEDMODEL IN DEVELOPMENT
What Structural Footfall Potential would have to clear
A designed formula is not a published measure. Seven steps sit between the two, and they are written down here so that publishing later has a standard to clear.
The Index and the four instruments are different objects
The District Index measures observed and derived district condition: what the tenure, the turnover and the ownership actually are. The four instruments interpret that condition for a capital decision. The Return Ladder reads traffic value, the Baseline Coverage Score reads durability without programming, the District Premium Score reads whether conditions support a premium, and the Mandate Scale reads whether anybody can act. The District Premium Score is not the District Index. The two are never used as synonyms. One is a measurement of the street. The other is a scored judgment about what that measurement supports.
Hall Capital Advisory does not claim to have invented population-based trip generation, pedestrian-demand forecasting or gravity modeling. Those methods have long precedents, and the Environmental Protection Agency's mixed-use trip generation work and Smart Location Database are the nearest standardized national precedent for the explanatory variables above. The proprietary contribution is narrower. It is the firm's district-level method for converting a standardized resident and worker structure into an auditable pedestrian-demand expectation. Then comparing that expectation with observed activity, and reading the result through the District Index and the four instruments.
EXTERNAL BENCHMARKHALL CAPITAL ADVISORY THRESHOLDEXTERNAL BENCHMARK covers the published trip-generation and pedestrian-demand literature. The district-scale conversion, its variables and its coefficients are Hall Capital Advisory's.
The earlier edition of this tab carried an ownership standing chart, an ownership finding, per-district records and a certified composite, all computed from the 5 September panel. It is superseded by the current release and is kept, unedited, so that its figures stay checkable against the methodology and data that produced them.
Open the superseded 6 September 2026 edition
SHA-256 of the archived page as published:
281123b8c6d84858f730f09309c00f280e66eb04ed5bb55a853d139df8bbe5c7
Rendered from District Index commit f4cef3c of 2026-09-12, payload build website-f4cef3c, methodology 2.0. Every figure here changes when that commit changes.